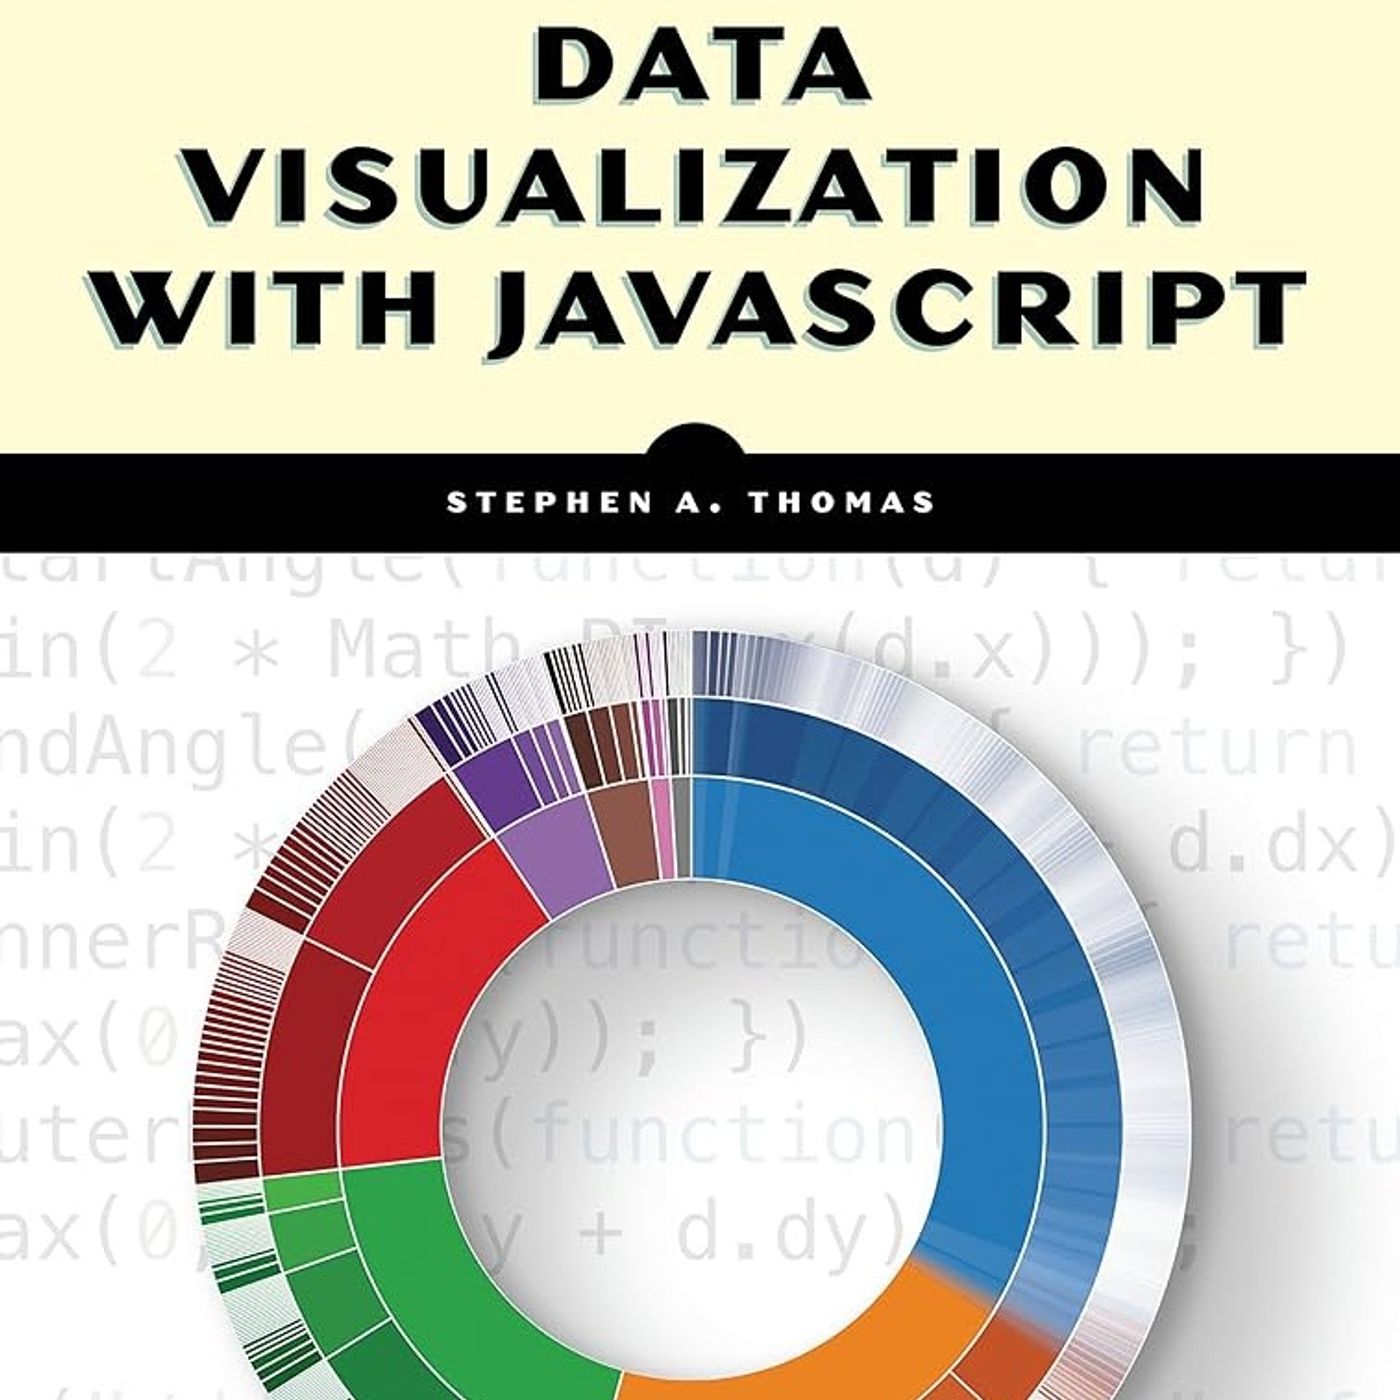
Data Visualization with JavaScript
About this episode
This episode provides a practical guide for developers on implementing effective data visualizations using JavaScript libraries.
A practical guide for developers to implement effective digital graphics using various code libraries. The text emphasizes that simplicity and clarity are paramount, as familiar formats like bar and line charts allow users to interpret data intuitively. By utilizing tools such as Flotr2 and D3.js, the author demonstrates how to construct interactive and static visualizations through step-by-step technical instructions. The source covers a wide range of applications, from geographic mapping and timelines to specialized structures like heat maps and word clouds. Additionally, Thomas addresses real-world development challenges, including cross-browser compatibility and debugging third-party library issues. Ultimately, the book serves as a roadmap for transforming abstract numerical sets into compelling, data-driven web applications. You can listen and download our episodes for free on more than 10 different platforms: https://linktr.ee/cyber_security_summary Get the Book now from Amazon…
More episodes of CyberSecurity Summary
- DEEP LEARNING: From Basics to Practice
- Data Wrangling with JavaScript
- Cyberspace and Cybersecurity
- D3.js in Action: Data visualization with JavaScript
- CSS in Depth
- Computer Science: An Interdisciplinary Approach
Explore listener stats, chart rankings, contacts and more on the CyberSecurity Summary podcast page.