Normal Curves: Sexy Science, Serious Statistics
by Regina Nuzzo and Kristin Sainani
Is this your podcast?Insights from recent episode analysis
Audience Interest
Podcast Focus
Publishing Consistency
Platform Reach
Insights are generated by CastFox AI using publicly available data, episode content, and proprietary models.
Most discussed topics
Brands & references
Total monthly reach
Estimated from 7 chart positions in 7 markets.
By chart position
- 🇦🇪AE · Science#623K to 10K
- 🇻🇳VN · Science#793K to 10K
- 🇳🇿NZ · Science#833K to 10K
- 🇭🇺HU · Science#873K to 10K
- 🇲🇾MY · Science#124500 to 3K
- Per-Episode Audience
Est. listeners per new episode within ~30 days
6.8K to 25K🎙 ~2x weekly·32 episodes·Last published yesterday - Monthly Reach
Unique listeners across all episodes (30 days)
14K to 49K🇦🇪20%🇻🇳20%🇳🇿20%+4 more - Active Followers
Loyal subscribers who consistently listen
5.4K to 20K
Market Insights
Platform Distribution
Reach across major podcast platforms, updated hourly
Total Followers
—
Total Plays
—
Total Reviews
—
* Data sourced directly from platform APIs and aggregated hourly across all major podcast directories.
On the show
From 13 epsHosts
Recent guests
No guests detected in recent episodes.
Recent episodes
Cancer Blood Tests Part 2: The clinical trial
Jun 29, 2026
57m 53s
Cancer Blood Tests: Are they ready for primetime? Part 1
Jun 15, 2026
43m 21s
Odds Ratios: Do most people get them wrong?
Jun 1, 2026
54m 49s
Coffee and the Heart: Is caffeine a trigger for AFib?
May 18, 2026
58m 08s
Sleep and Exercise: Does working out on too little sleep speed up aging?
May 4, 2026
1h 06m 09s
Social Links & Contact
Official channels & resources
Official Website
Login
RSS Feed
Login
| Date | Episode | Topics | Guests | Brands | Places | Keywords | Sponsor | Length | |
|---|---|---|---|---|---|---|---|---|---|
| 6/29/26 |  Cancer Blood Tests Part 2: The clinical trial | How do you decide whether a clinical trial “worked”? In Part 2 of our Galleri series, we examine the landmark randomized trial of a blood test designed to detect more than 50 cancers. We explore why different outcome measures led to dramatically different headlines, discuss primary versus secondary outcomes, pre-registration, hierarchical testing, and post hoc analyses, and explain why mortality remains the outcome everyone is waiting for. Along the way, we uncover a statistical mystery involving dozens of missing cancers and discover how a little arithmetic can sometimes reveal more than a press release.Statistical topicscancer screeningexploratory analyseshierarchical testingmissing datamultiple testingoutcome measurespost hoc analysespre-registrationprimary and secondary outcomesrandomized clinical trialsscreening testsMethodologic Morals“When the simple numbers don't add up, pay attention. The arithmetic may be trying to tell you something.”“The first question should not be, did it work? It should be, what counts as success?”ReferencesGiridhar KV, et al. Safety and performance results from PATHFINDER 2, a registrational study of a multi-cancer early detection test in an intended-use population. Presented at the 2026 American Society of Clinical Oncology (ASCO) Annual Meeting. May 2026.Hubbell E, Clarke CA, Aravanis AM, Berg CD. Modeled Reductions in Late-stage Cancer with a Multi-Cancer Early Detection Test. Cancer Epidemiol Biomarkers Prev. 2021;30(3):460-468. doi:10.1158/1055-9965.EPI-20-1134Neal RD, Johnson P, Clarke CA, et al. Cell-Free DNA-Based Multi-Cancer Early Detection Test in an Asymptomatic Screening Population (NHS-Galleri): Design of a Pragmatic, Prospective Randomised Controlled Trial. Cancers (Basel). 2022;14(19):4818. Published 2022 Oct 1. doi:10.3390/cancers14194818ASCO slides: https://grail.com/wp-content/uploads/2026/05/Swanton_ASCO-2026_NHS-Galleri_FINAL-Slides-05.26.2026.pdfUK registry protocol: https://www.isrctn.com/ISRCTN91431511 Clinicaltrials.gov protocol: https://clinicaltrials.gov/study/NCT05611632 Common biases in cancer screening studiesCancer screening studies are subject to several well-known biases that can make a screening test appear more effective than it actually is. Three of the most important are:Lead-time bias: Screening advances the time of diagnosis, making survival from diagnosis appear longer even if the patient's lifespan is unchanged. For example, if a screening test detects a Stage II cancer at age 60 that otherwise would have been diagnosed because of symptoms at age 62, but the patient dies at age 68 regardless, survival from diagnosis appears to increase from 6 years to 8 years even though the patient did not live any longer. Length bias: Screening preferentially detects slower-growing, less aggressive cancers because they remain detectable for longer than fast-growing cancers. For example, a slow-growing cancer that remains in Stage I for 5 years is much more likely to be found by screening than an aggressive cancer that progresses to symptoms within months. This can make screened patients appear to have better survival simply because screening preferentially found the less aggressive cancers. Overdiagnosis: Screening detects cancers that would never have caused symptoms or death during a person's lifetime, leading to unnecessary diagnosis and treatment. For example, a screening test may detect a very slow-growing prostate or thyroid cancer in an older adult that would never have become clinically important if it had remained undiscovered. Kristin and Regina’s online courses: Demystifying Data: A Modern Approach to Statistical Understanding Clinical Trials: Design, Strategy, and Analysis Medical Statistics Certificate Program Writing in the Sciences Epidemiology and Clinical Research Graduate Certificate Program Programs that we teach in:Epidemiology and Clinical Research Graduate Certificate Program Find us on:Kristin - LinkedIn & Twitter/XRegina - LinkedIn & ReginaNuzzo.com(00:00) - Intro (03:39) - The Claim: Not Ready for Primetime (03:58) - Trial Design: 142,000 Participants (07:50) - The Primary Outcome Problem (20:29) - The Primary Endpoint: Complete Miss (22:14) - Three Arguments for the Defense (28:29) - - Statistical Sleuthing: Missing Cancers (41:14) - - The Stage Shift Argument (50:30) - - Rating the Claim | 57m 53s | ||||||
| 6/15/26 |  Cancer Blood Tests: Are they ready for primetime? Part 1 | Can a single tube of blood really detect dozens of cancers before symptoms appear? We dive into the science behind Galleri, a blood test that claims to detect more than 50 types of cancer from a simple blood draw. Recent headlines about the test ranged from “breakthrough” to “bust” after the release of results from a massive randomized clinical trial. In this Part 1 episode, we explore cell-free DNA, DNA methylation, machine learning, sensitivity, specificity, and positive predictive value. Along the way, we revisit the prenatal screening revolution, ask why detecting cancer earlier doesn’t always help patients, and learn how escaped DNA convicts end up swimming in a giant molecular pool party. And for the first time ever, Normal Curves ends on a cliffhanger: we’ll save the controversial results of that landmark trial for Part 2.Statistical topicscancer screeningcase-control studiescounterfactualsmachine learningnegative predictive valueoverdiagnosispositive predictive valuerandomized clinical trialsscreening testssensitivity and specificityvalidationReferencesBianchi DW, Chudova D, Sehnert AJ, et al. Noninvasive prenatal testing and incidental detection of occult maternal malignancies. JAMA. 2015; 314:162-9. Liu MC, Oxnard GR, Klein EA, et al. Sensitive and specific multi-cancer detection and localization using methylation signatures in cell-free DNA. Ann Oncol. 2020. 31:745-59. Schrag D, Beer T, McDonnell C et al. Blood-based tests for multicancer early detection (PATHFINDER): a prospective cohort study. The Lancet. 402: 1251-60.Giridhar KV, et al. Safety and performance results from PATHFINDER 2, a registrational study of a multi-cancer early detection test in an intended-use population. Presented at the 2026 American Society of Clinical Oncology (ASCO) Annual Meeting. May 2026.Statistic discussed in the episodePATHFINDER 2 investigators reported that adding Galleri to routine screening increased the number of screen-detected cancers by 6.5-fold. This figure compares 31 cancers detected through USPSTF-recommended screening (for breast, cervical, lung, and colon) with 204 cancers detected when Galleri was added, counting the same 31 conventional-screening cancers in both totals. Thus, describing the increase as 6.5-fold is misleading, since the combination of Galleri plus conventional screening is, by definition, guaranteed to detect at least as many cancers as conventional screening alone. Moreover, everyone in the study received Galleri, whereas conventional screening depended on which tests participants happened to be due for and completed during the study period. The comparison therefore does not involve two equally applied screening strategies.Kristin and Regina’s online courses: Demystifying Data: A Modern Approach to Statistical Understanding Clinical Trials: Design, Strategy, and Analysis Medical Statistics Certificate Program Writing in the Sciences Epidemiology and Clinical Research Graduate Certificate Program Programs that we teach in:Epidemiology and Clinical Research Graduate Certificate Program Find us on:Kristin - LinkedIn & Twitter/XRegina - LinkedIn & ReginaNuzzo.com(00:00) - - Introduction (00:44) - - The Holy Grail of Cancer Testing (04:31) - - Headlines: Same Data, Opposite Stories (07:38) - - How Cell-Free DNA Works (13:54) - - DNA Methylation: GRAIL's Fingerprint (15:19) - - The Origin Story (22:18) - - The Pathfinder Studies (35:01) - - The Paradox: Why Earlier Detection Doesn't Always Help (40:32) - - The Cliffhanger | 43m 21s | ||||||
| 6/1/26 |  Odds Ratios: Do most people get them wrong?✨ | odds ratiosrisk ratios+4 | — | Am J Public HealthYouTube | — | odds ratiosrisk ratios+6 | — | 54m 49s | |
| 5/18/26 | 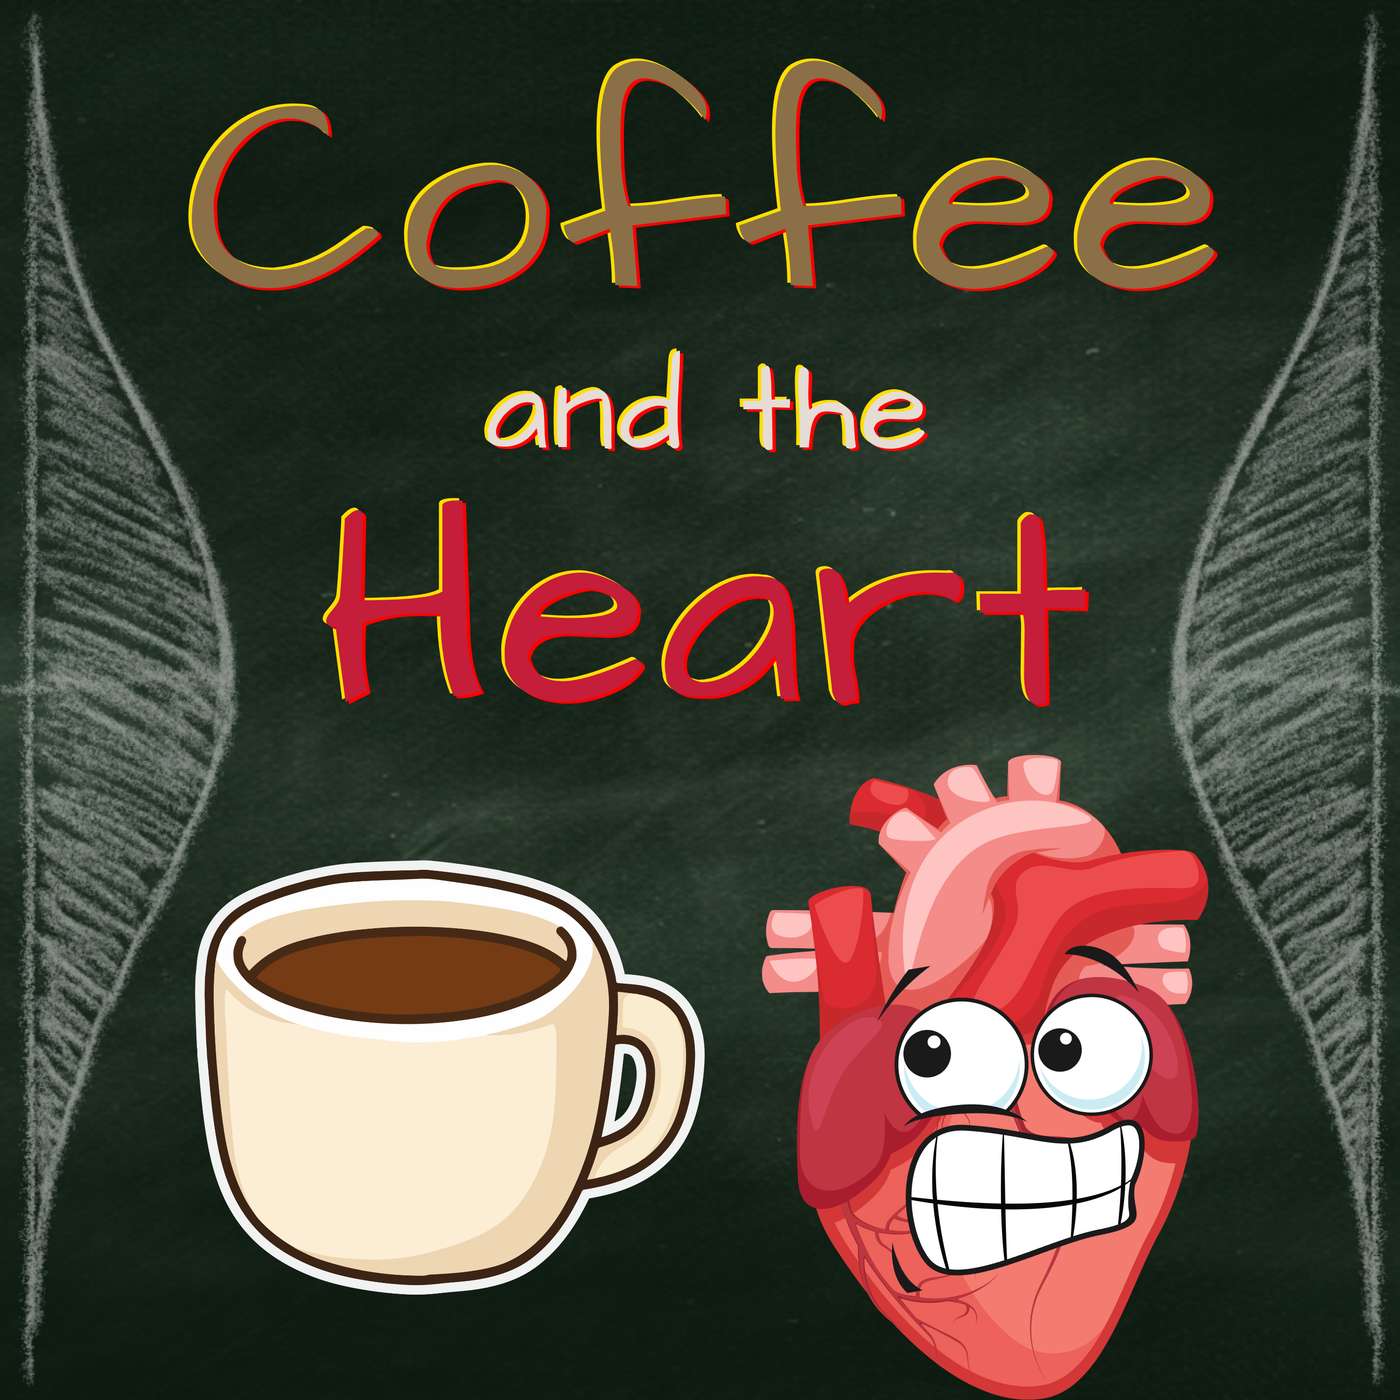 Coffee and the Heart: Is caffeine a trigger for AFib?✨ | caffeineatrial fibrillation+4 | — | N Engl J Med | — | caffeineAFib+5 | — | 58m 08s | |
| 5/4/26 | 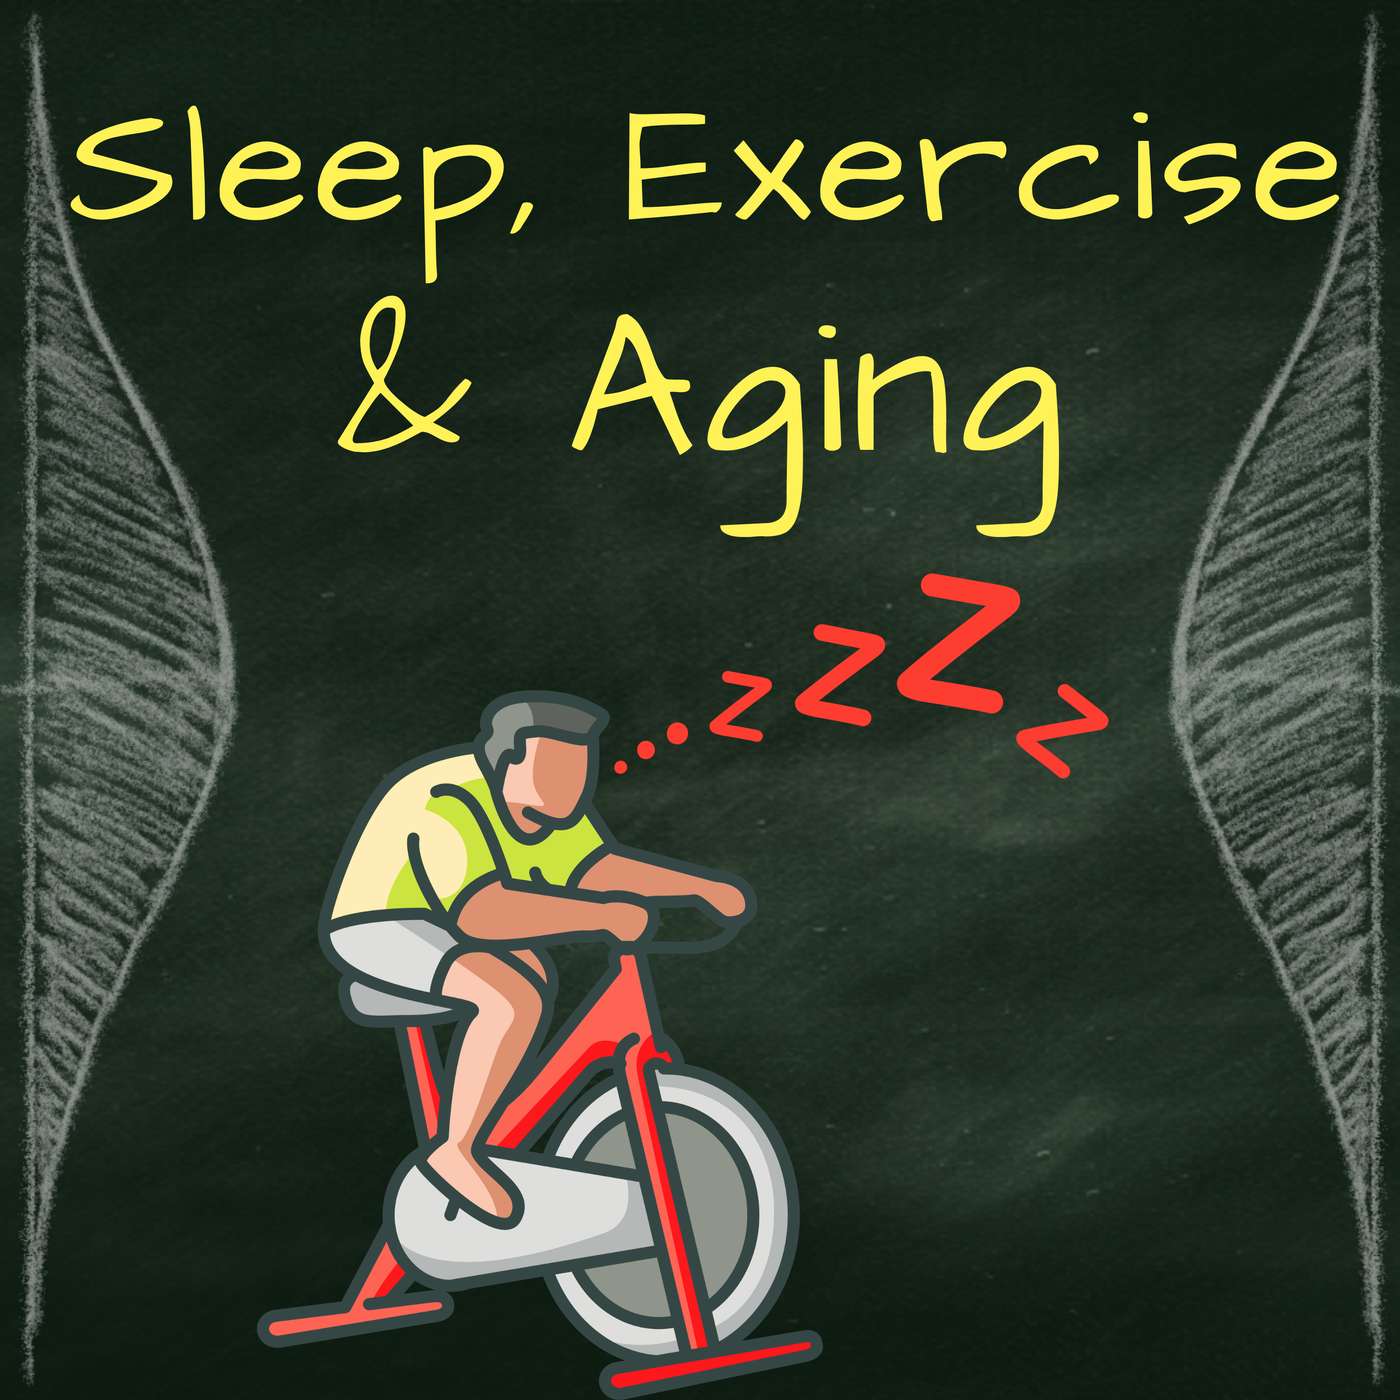 Sleep and Exercise: Does working out on too little sleep speed up aging?✨ | sleepexercise+4 | — | $400,000 handbag | — | sleep deprivationexercise+5 | — | 1h 06m 09s | |
| 4/20/26 | 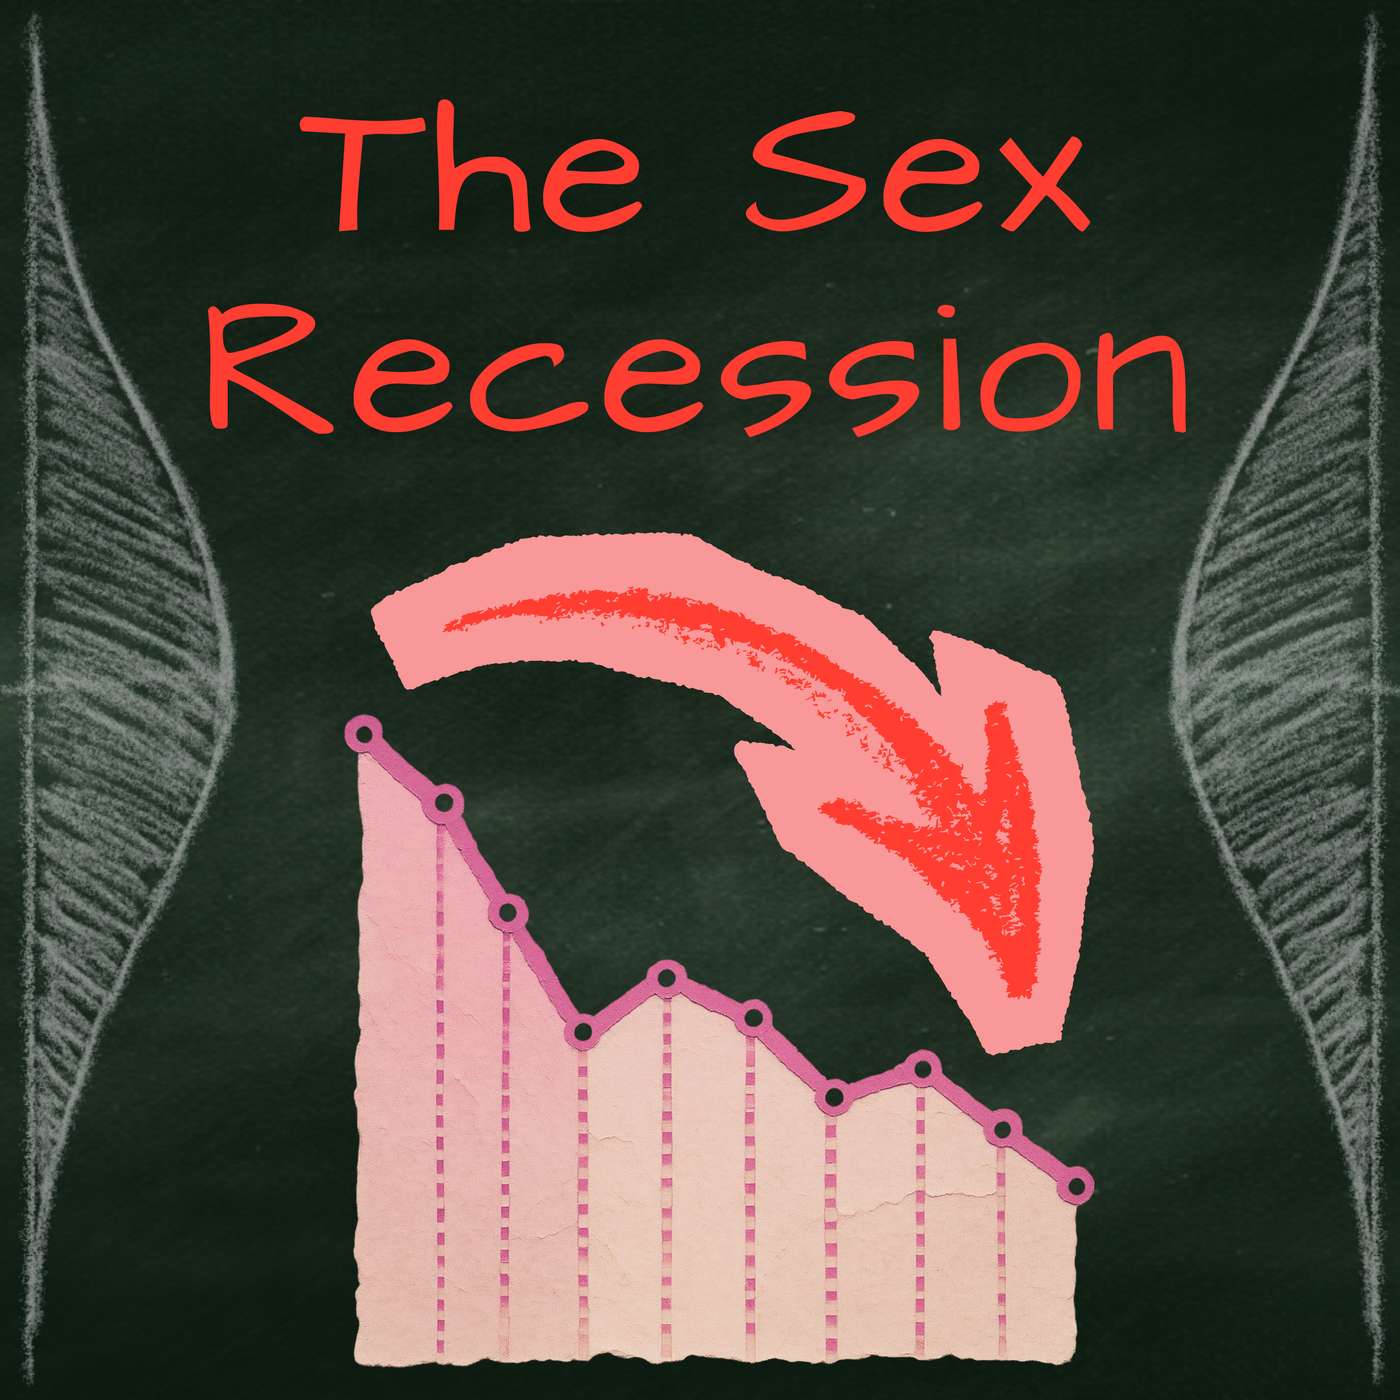 Sex Recession: Are young people really having less sex?✨ | sex recessiondata analysis+4 | — | The AtlanticSex Recession: Are young people really having less sex?+3 | — | sex recessionyouth sexuality+7 | — | 1h 08m 35s | |
| 4/6/26 | 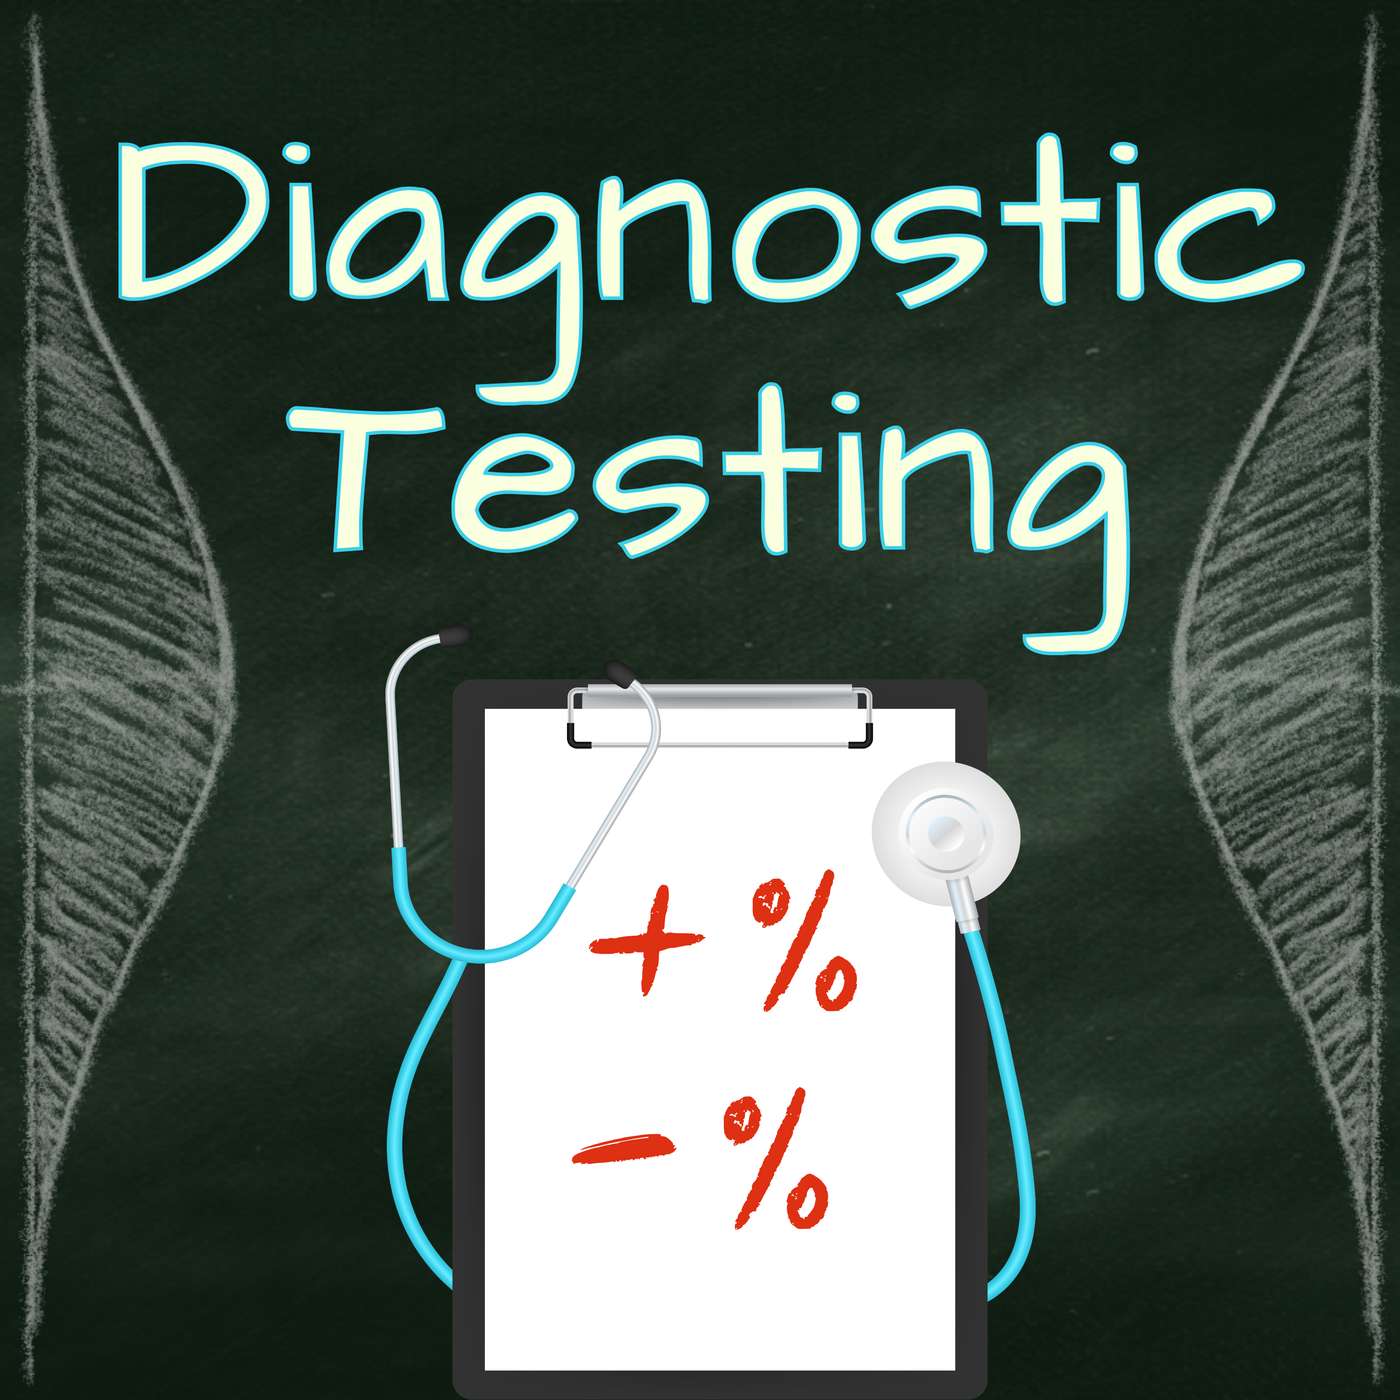 Diagnostic Testing: Do the stats tell you what you need to know?✨ | diagnostic testingsensitivity+4 | — | Journal of the European Academy of Dermatology and VenereologyA multilocus candidate approach identifies ACE and HIF1A as susceptibility genes for cellulite | — | diagnostic testsBayes' theorem+4 | — | 1h 08m 48s | |
| 3/23/26 | 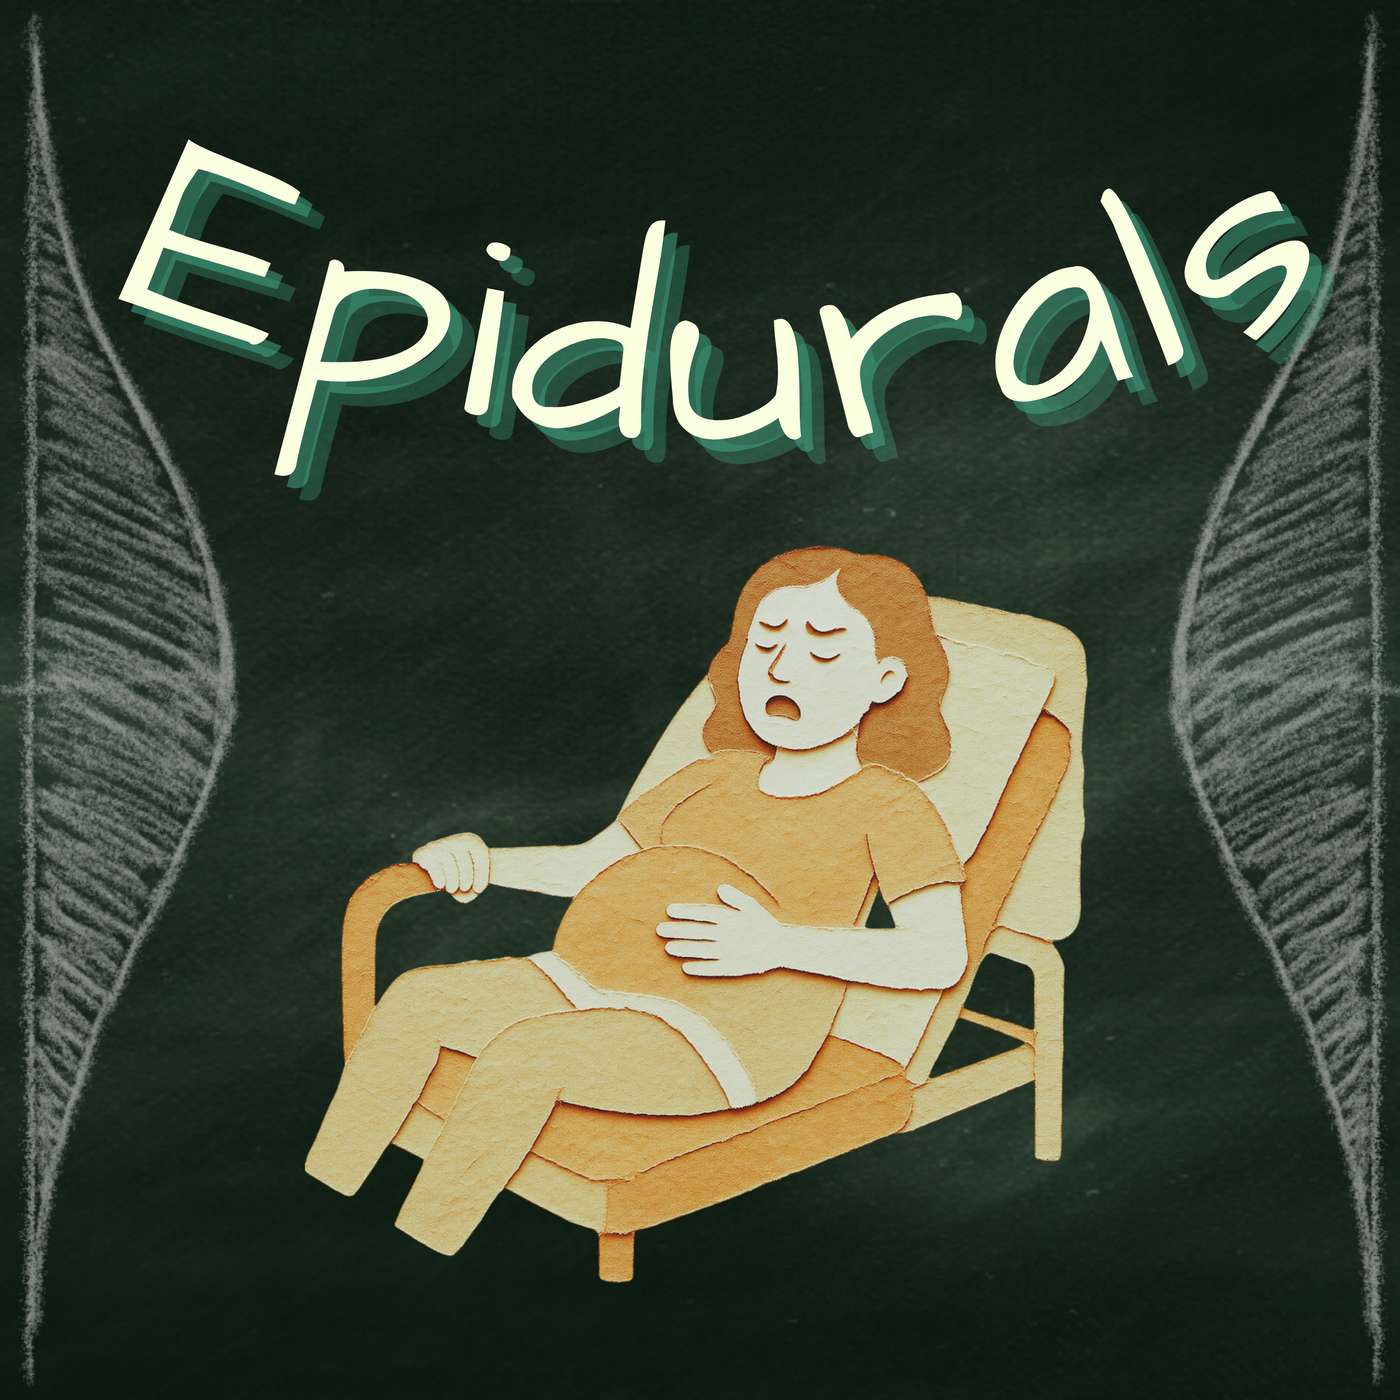 Epidurals: Are labor epidurals really linked to autism?✨ | epiduralsautism+4 | — | — | — | epiduralsautism+6 | — | 1h 10m 35s | |
| 3/9/26 | 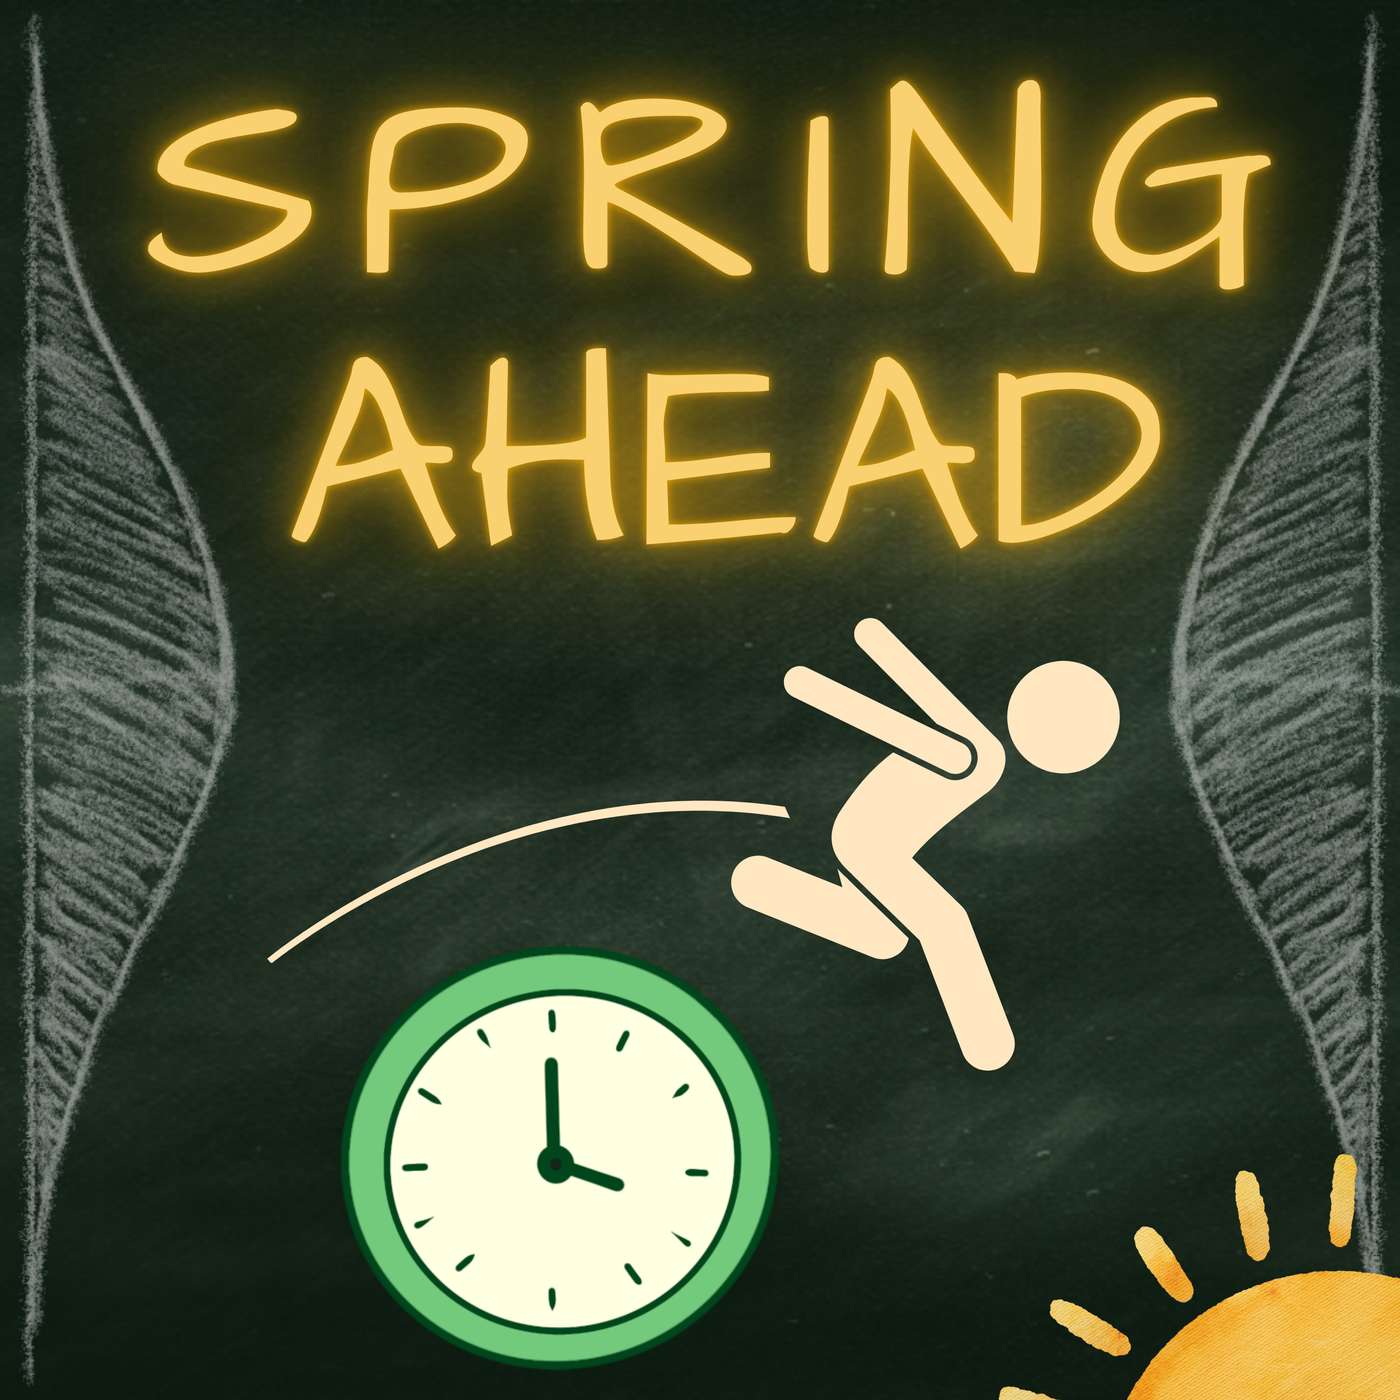 Daylight Saving Time: Does springing forward cause heart attacks?✨ | daylight saving timeheart attacks+4 | — | New England Journal of MedicineBBC Future | — | daylight saving timeheart attacks+5 | — | 1h 04m 45s | |
| 2/23/26 | 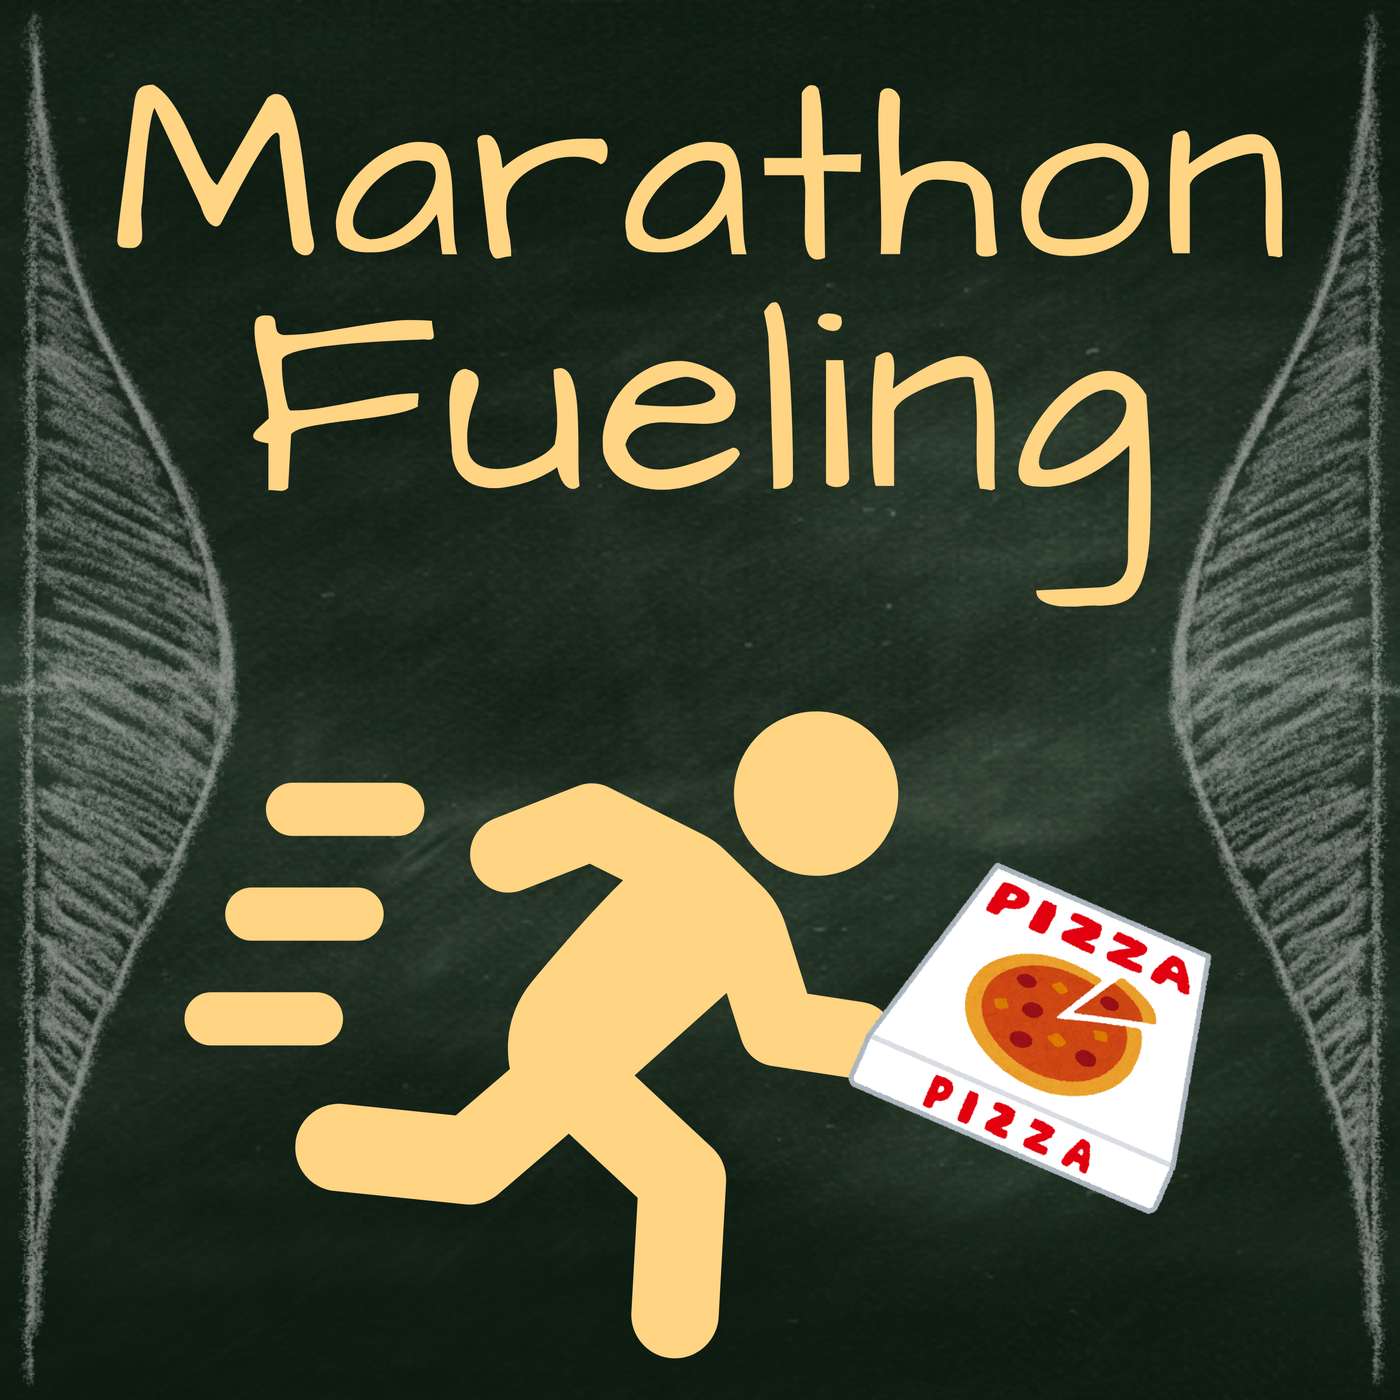 Marathon Performance: Does high-carb fueling work?✨ | marathon performancecarbohydrate fueling+4 | — | J Appl Physiol13C-labelled glucose–fructose | — | carbohydratesmarathon+4 | — | 1h 06m 44s | |
Want analysis for the episodes below?Free for Pro Submit a request, we'll have your selected episodes analyzed within an hour. Free, at no cost to you, for Pro users. | |||||||||
| 2/9/26 |  Falling in Love: Do the 36 Questions Actually Work?✨ | psychologylove+4 | — | New York TimesModern Love+1 | — | 36 Questionslove+5 | — | 1h 01m 58s | |
| 1/26/26 |  Bonus: Pheromones with commentary✨ | pheromonesdating strategies+4 | — | Los Angeles TimesYahoo!life+1 | — | pheromonessweaty t-shirt study+5 | — | 1h 04m 03s | |
| 1/12/26 |  Bonus: Sugar Sag with Commentary✨ | dietskin aging+4 | — | Sugar SagDiabetes+2 | — | sugar sagskin aging+5 | — | 1h 13m 48s | |
| 12/29/25 |  Bonus: Vitamin D Part 1 with commentary✨ | vitamin Ddeficiency epidemic+4 | — | Huberman Lab PodcastA Case of Nutritional Osteomalacia in Young Adult | — | vitamin D deficiencystatistical cockroaches+5 | — | 1h 29m 19s | |
| 12/15/25 |  The Batman Effect: Do weird surprises make people nicer?✨ | prosocail behaviorfield experiments+4 | — | Npj Ment Health ResPubPeer+1 | — | Batman Effectprosocial behavior+5 | — | 47m 16s | |
| 12/1/25 | 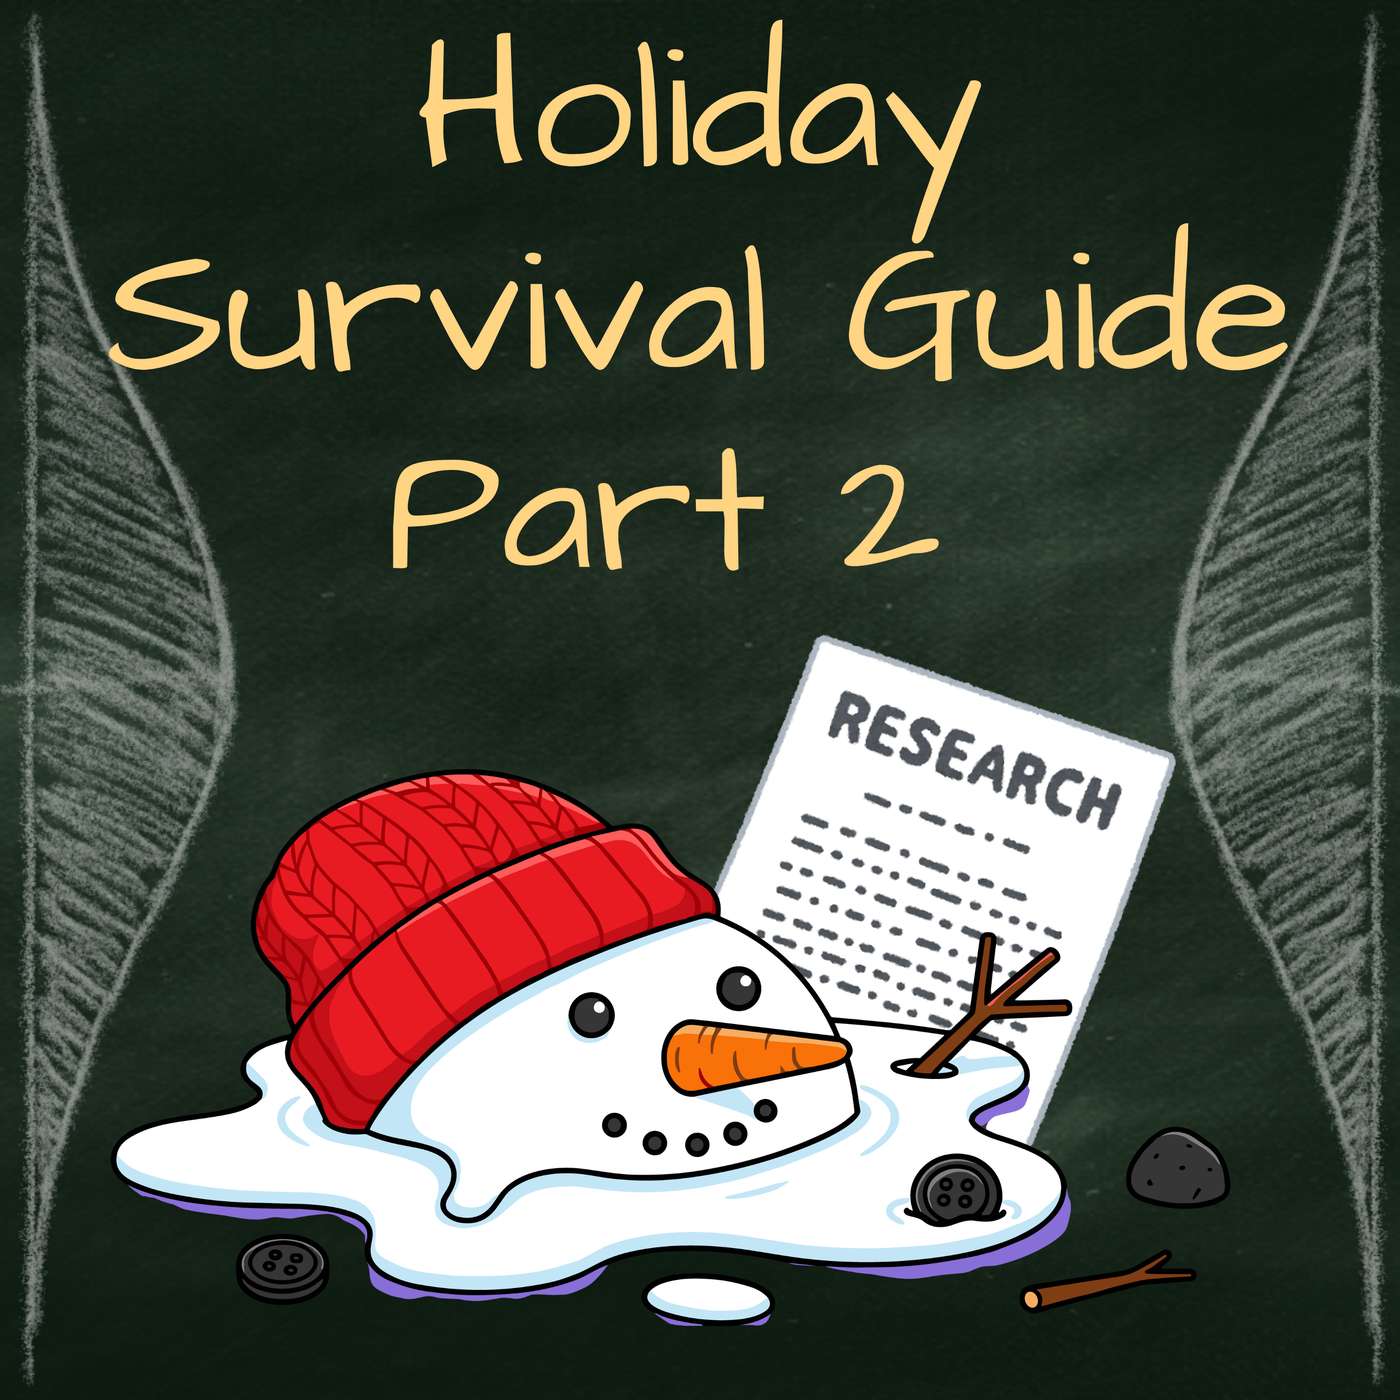 Holiday Survival Guide Part 2: The survey study edition | Does the temperature of your coffee six months ago really predict whether you feel gassy today? This week we dissect a new nutrition survey study on hot and cold beverage habits that claims to connect drink temperature with gut symptoms, anxiety, and more—despite relying on year-old memories and a blizzard of statistical tests. It’s the perfect case study for our Holiday Survival Guide Part 2, where we teach you how to talk with Uncle Joe at the dinner table about one of the most common—and most fraught—study designs in science: cross-sectional surveys. We walk through our easy checklist for making sense of results, show how recall bias and measurement error can skew the story, and reacquaint you with nonmonogamous Multiple-Testing Dude, who’s been very busy in this dataset. A friendly, practical guide to spotting when researchers are just torturing the data until it confesses.Statistical topicsConfoundingCross-sectional studiesFalse positivesMeasurement errorMultiple testingPICOT / PIVOT frameworkRecall biasResearch hypothesesSample size and powerSignal vs. noiseSMART frameworkStatistical significanceSubgroup analysesSurvey designTransparency and trustworthinessMethodological morals“When your measurement starts with ‘think back to last winter’ you might as well use a random number generator.”“If the effect is only significant in certain subgroups in certain seasons for certain outcomes, it might just be a bad case of gas.”ReferencesWu T, Doyle C, Ito J, et al. Cold Exposures in Relation to Dysmenorrhea among Asian and White Women. Int J Environ Res Public Health. 2023;21(1):56. Published 2023 Dec 30. doi:10.3390/ijerph21010056Wu T, Ramesh N, Doyle C, Hsu FC. Cold and hot consumption and health outcomes among US Asian and White populations. Br J Nutr. Published online September 18, 2025. doi:10.1017/S000711452510514XKristin and Regina’s online courses: Demystifying Data: A Modern Approach to Statistical Understanding Clinical Trials: Design, Strategy, and Analysis Medical Statistics Certificate Program Writing in the Sciences Epidemiology and Clinical Research Graduate Certificate Program Programs that we teach in:Epidemiology and Clinical Research Graduate Certificate Program Find us on:Kristin - LinkedIn & Twitter/XRegina - LinkedIn & ReginaNuzzo.com(00:00) - Intro (04:36) - Did they have real research hypotheses? (10:29) - Observational or randomized experiment? (19:25) - PICOT and PIVOT (25:36) - Memory problems (31:19) - Five outcomes and measurement problems therein (36:12) - SMART (40:31) - Multiple Testing Dude is having a great time (51:17) - How big is the effect? (57:47) - Wrap-up and Irish Coffee rating scale | 1h 02m 42s | ||||||
| 11/17/25 | 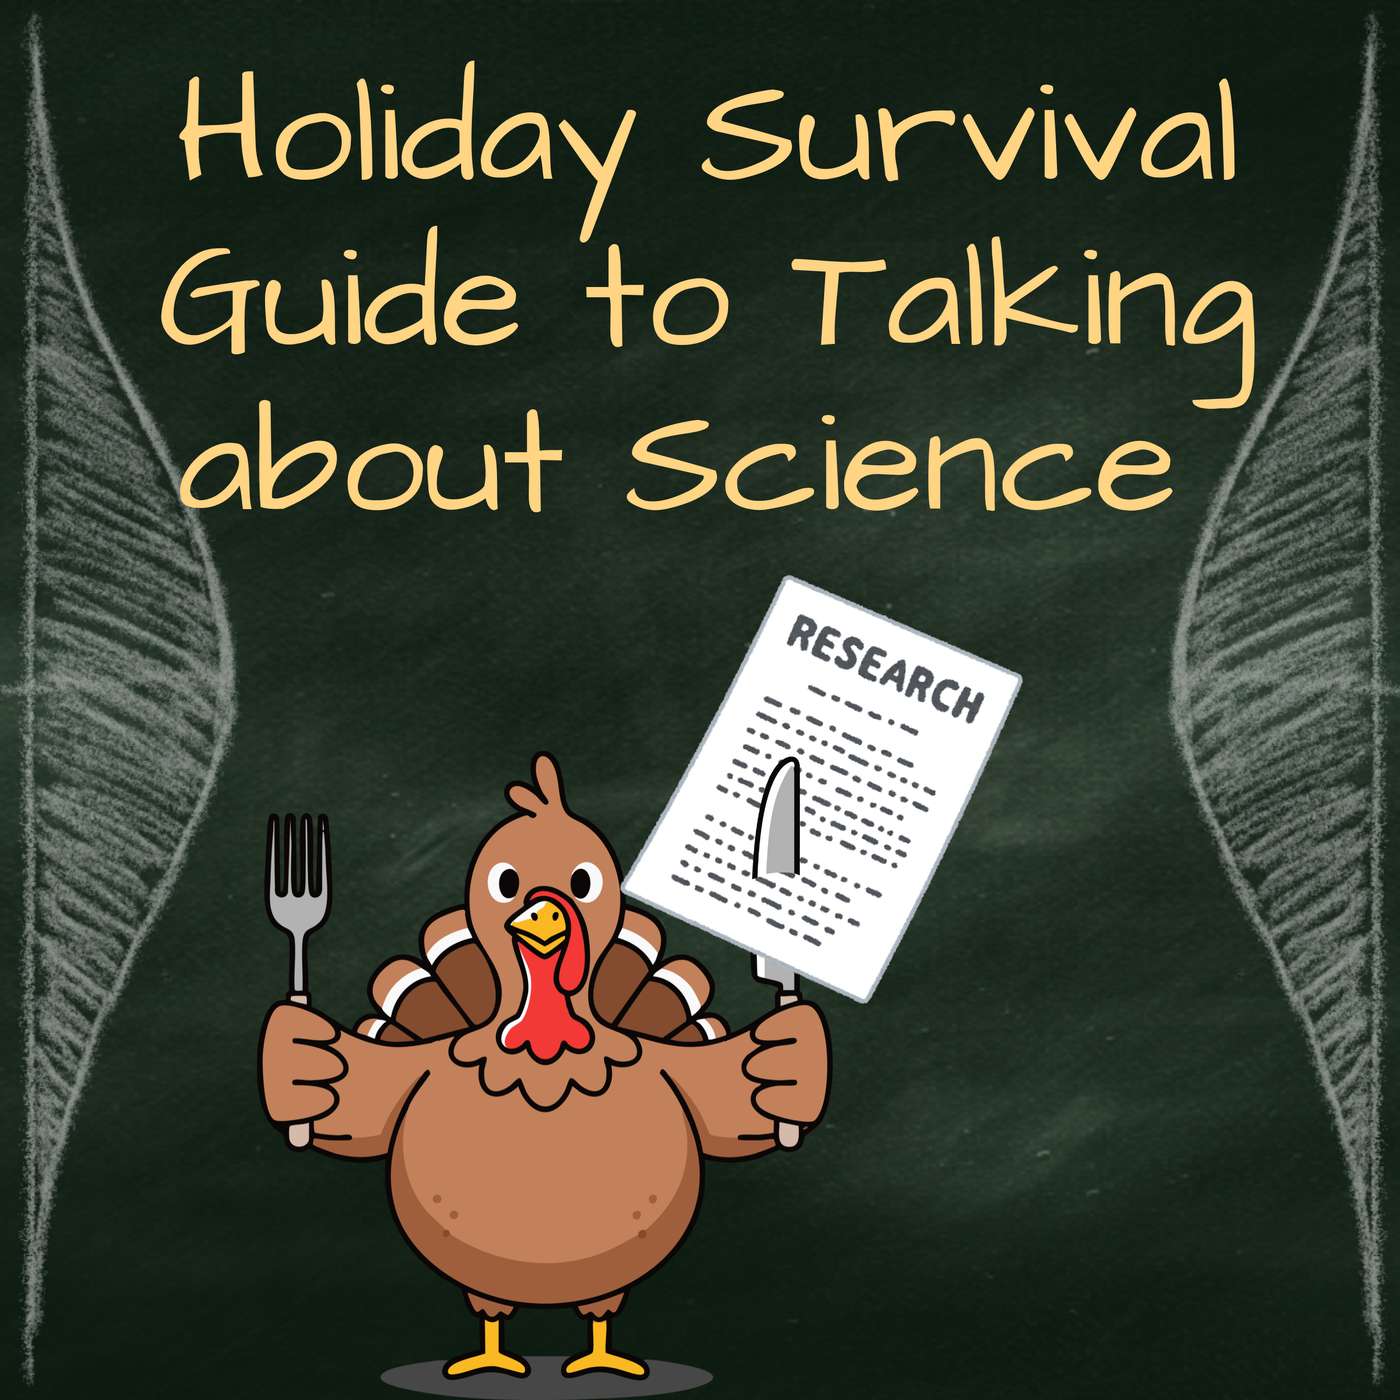 Holiday Survival Guide: How to talk about scientific studies around the dinner table | Does a little alcohol really make you speak a foreign language better? This week we unpack a quirky randomized trial that tested Dutch pronunciation after a modest buzz—and came to the opposite conclusion the researchers expected. We use it as the perfect holiday case study: instead of arguing with Uncle Joe at the dinner table, we’ll show you how to pull apart a scientific headline using a friendly, practical checklist anyone can learn. Along the way we stress-test the study’s claims, take a quick detour into what a .04% buzz actually looks like, and run our own before-and-after experiment with two brave science journalists at the ScienceWriters2025 conference in Chicago. A holiday survival guide with vodka tonics, statistical sleuthing, and a few surprisingly smooth French phrases.Statistical topicsAlternative explanationsArithmetic consistency / GRIM testBlindingEffect size / magnitudeGeneralizability / external validityObservational studies vs. experimentsOutcome measurementPICOT frameworkPlacebo and expectancy effectsPrimary outcomes / pre-specificationRandomized controlled trialsResearch hypothesesSample size SMART frameworkStatistical significance (signal vs. noise)Transparency and trustworthinessMethodological morals“You don't need a PhD to read a study. Just remember, PICOT and SMART.”“A decimal point can mean the difference between life and death. Details matter.”ReferencesRenner F, Kersbergen I, Field M, Werthmann J. Dutch courage? Effects of acute alcohol consumption on self-ratings and observer ratings of foreign language skills. J Psychopharmacol. 2018;32(1):116-122. doi:10.1177/0269881117735687Kristin and Regina’s online courses: Demystifying Data: A Modern Approach to Statistical Understanding Clinical Trials: Design, Strategy, and Analysis Medical Statistics Certificate Program Writing in the Sciences Epidemiology and Clinical Research Graduate Certificate Program Programs that we teach in:Epidemiology and Clinical Research Graduate Certificate Program Find us on:Kristin - LinkedIn & Twitter/XRegina - LinkedIn & ReginaNuzzo.com (00:00) - Intro (03:30) - Uncle Joe and the question of alcohol (07:20) - Randomized controlled trial (10:10) - PICOT mnemonic (15:43) - Just how drunk? (21:41) - Boring non-placeb (32:29) - Kristin’s SMART mnemonic (38:15) - How big of an effect? (49:29) - Two science journalists walk into a bar (55:43) - Martini scale and wrap-up | 1h 00m 29s | ||||||
| 11/3/25 | 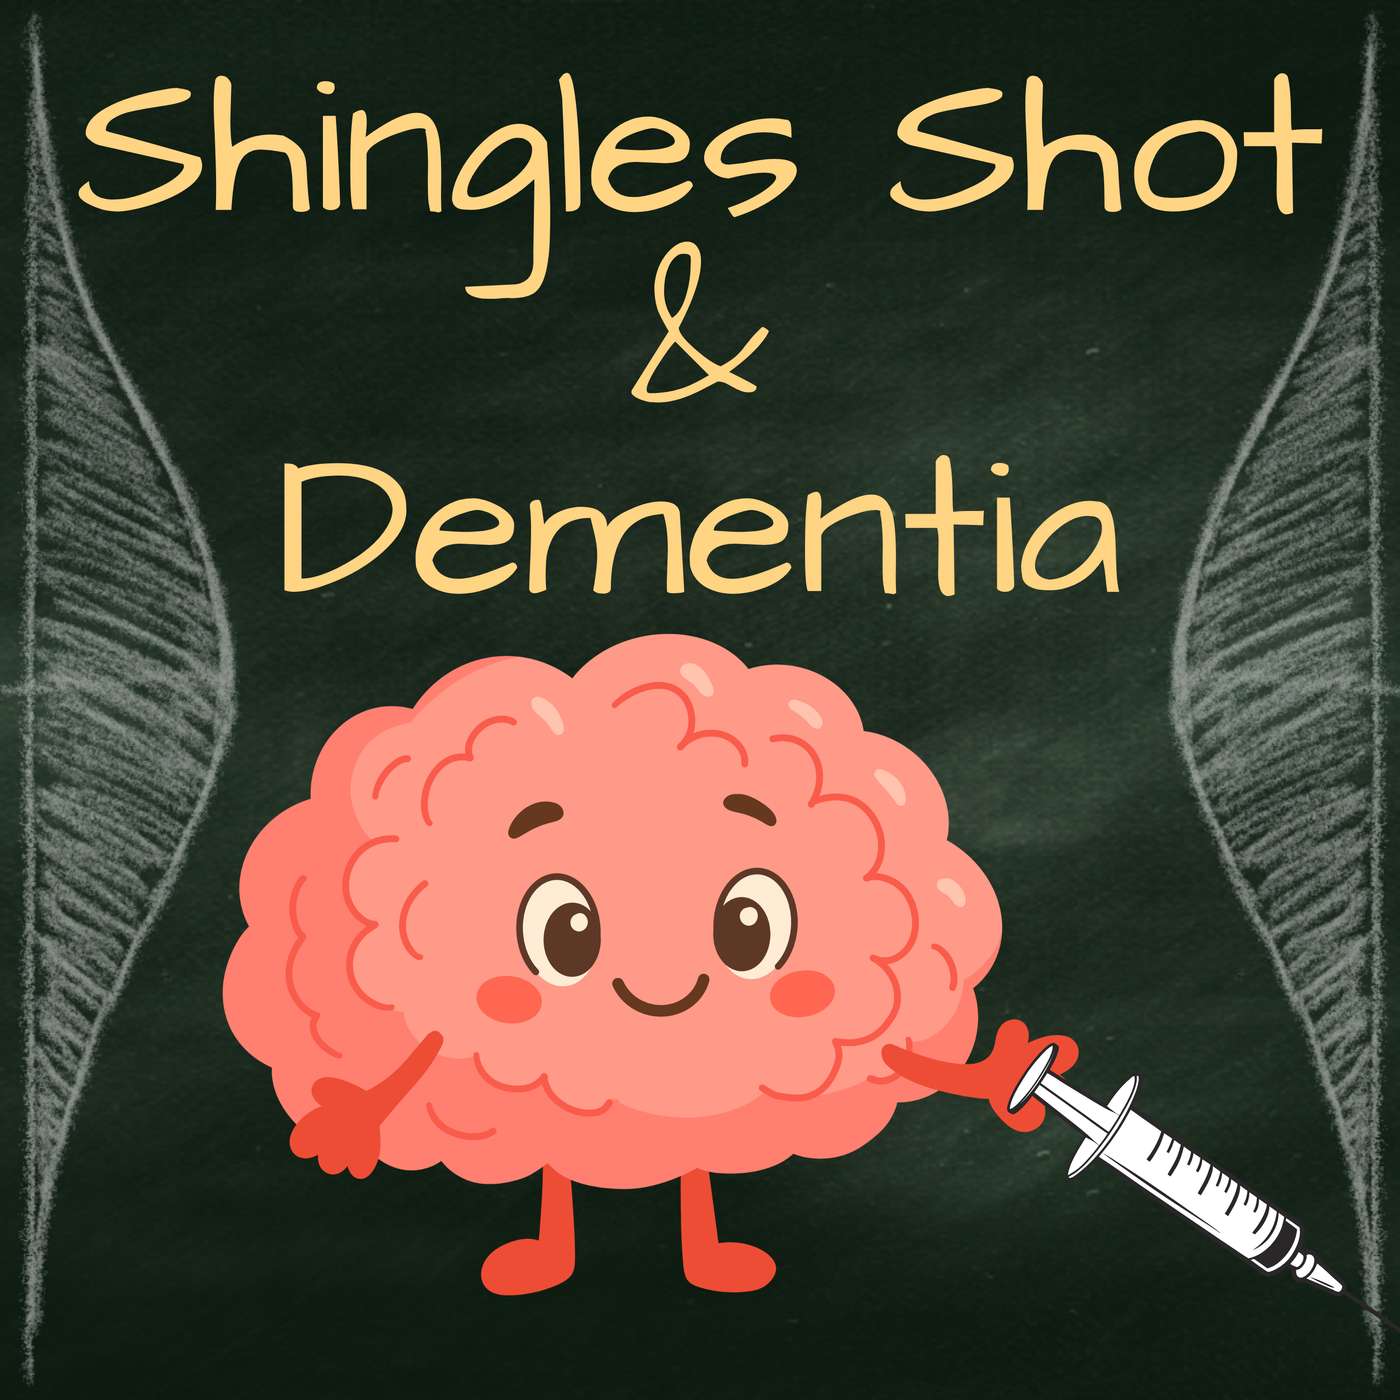 Shingles Shot and Dementia: Could one vaccine protect your brain? | What do chickenpox and shingles have to do with your brain? This week, we dig into two 2025 headline-grabbing studies that link the shingles shot to lower dementia rates. We start in Wales, where a birthday cutoff turned into the perfect natural experiment, and end in the U.S. with a multi-million-person megastudy. Featuring bias-variance Goldilockses, Fozzy-the-Bear regression discontinuities, a Barbie-versus-Oppenheimer showdown for propensity scores – and the hottest rebrand of inverse-probability weighting you’ll ever hear.Statistical topicsAbsolute vs. relative riskBias–variance tradeoffCausal inferenceCensoringConfoundingFuzzy regression discontinuity designHealthy-user biasInverse probability of treatment weighting (IPTW)Longitudinal studyNatural experimentNegative controlsOptimal bandwidthPropensity scoresSelection biasSubgroup analysisTriangular kernel weightsMethodological morals“Propensity scores are the lipstick you put on observational pigs.”“Natural experiments are a hot flirtation date with causality.”ReferencesEyting M, Xie M, Michalik F, Heß S, Chung S, Geldsetzer P. A natural experiment on the effect of herpes zoster vaccination on dementia. Nature. 2025 May;641(8062):438-446. doi: 10.1038/s41586-025-08800-x. Epub 2025 Apr 2. PMID: 40175543; PMCID: PMC12058522.Polisky V, Littmann M, Triastcyn A, et al. Varicella-zoster virus reactivation and the risk of dementia. Nat Med. Published online October 6, 2025. doi:10.1038/s41591-025-03972-5Sainani KL. Propensity scores: uses and limitations. PM&R 2012; 4:693-97.Detailed Show Notes PageKristin and Regina’s online courses: Demystifying Data: A Modern Approach to Statistical Understanding Clinical Trials: Design, Strategy, and Analysis Medical Statistics Certificate Program Writing in the Sciences Epidemiology and Clinical Research Graduate Certificate Program Programs that we teach in:Epidemiology and Clinical Research Graduate Certificate Program Find us on:Kristin - LinkedIn & Twitter/XRegina - LinkedIn & ReginaNuzzo.com(00:00) - Intro and first gratuitous mention of sex (03:56) - What are shingles, chickenpox, and the vaccines against them? (12:30) - Fun facts about the varicella zoster and herpes viruses (17:16) - A natural experiment in Wales (21:10) - What is the Goldilocks optimal bandwidth? (25:33) - Fuzzy regression discontinuity design demystified (31:59) - Shingles vaccine vs dementia showdown (33:29) - Absolute risk reduction paradox (37:00) - Effects for men and women differ (39:48) - A giant longitudinal study (46:32) - Propensity scores demystified via Barbie and Oppenheimer (52:36) - Using propensity scores to make matches (56:49) - Inverse probability of treatment weighting demystified via more Barbenheimer (01:01:08) - Attempts to rename IPTW for TikTok (01:04:40) - Longitudinal study results (01:08:41) - Smooch ratings and methodological morals: pigs and hot dates | 1h 11m 38s | ||||||
| 10/20/25 |  Scary Bridge Study: Can fear make you horny? | What if a haunted house makes your date look hotter? This week we dive into the infamous Scary Bridge Study — the 1970s classic that launched a thousand pop-psych takes on fear and lust. It’s the one with the swaying bridge, pretty “research assistant,” and phone number scrawled on torn paper. The study became legend, but how sturdy were its stats? We retrace the design, redo the numbers, and see how many math errors it takes to sway a suspension bridge. Along the way we find an erotic-fiction writing exercise, Adventure Dudes choosing their own experimental groups, and snarky replicators who tried (and failed) to make fear sexy again. We wrap with what the latest research says about when fear really does boost attraction — and when it backfires spectacularly. A Halloween story of danger, desire, and unconscious sexual drive. This episode has a video version! https://www.youtube.com/watch?v=2coWoS_3460Statistical topicsArithmetic checksChi-square testConfoundersGRIM testInter-rater reliabilityMeta-analysisNegative controlRandomizationReplication Sample sizeSignal vs. noiseStatistical sleuthingSubjective measurementT-testMethodological morals“Those who don't verify their numbers dig their own statistical graves.”“Famous doesn't mean flawless.”ReferencesBrown, NJ, Heathers, JA. The GRIM test: A simple technique detects numerous anomalies in the reporting of results in psychology. Social Psychological and Personality Science. 2017; 8(4):363-369.Dutton DG, Aron AP. Some evidence for heightened sexual attraction under conditions of high anxiety. J Pers Soc Psychol. 1974;30(4):510-517. doi:10.1037/h0037031Foster CA, Witcher BS, Campbell WK, Green JD. Arousal and attraction: Evidence for automatic and controlled processes. J Pers Soc Psychol. 1998;74(1):86-101.Kenrick DT, Cialdini R, Linder D. Misattribution under fear-producing circumstances: Four failures to replicate. Pers Soc Psychol Bull. 1979;5(3):329-334.van der Zee T, Anaya J, Brown NJL. Statistical heartburn: an attempt to digest four pizza publications from the Cornell Food and Brand Lab. BMC Nutr. 2017;3:54. Published 2017 Jul 10. doi:10.1186/s40795-017-0167-xhttp://www.prepubmed.org/grim_test/Kristin and Regina’s online courses: Demystifying Data: A Modern Approach to Statistical Understanding Clinical Trials: Design, Strategy, and Analysis Medical Statistics Certificate Program Writing in the Sciences Epidemiology and Clinical Research Graduate Certificate Program Programs that we teach in:Epidemiology and Clinical Research Graduate Certificate Program Find us on:Kristin - LinkedIn & Twitter/XRegina - LinkedIn & ReginaNuzzo.com(00:00) - Intro: Fear and Flirtation on a Suspension Bridge (05:40) - A Classic 1970s Experiment with No IRB to be Found (11:15) - Adventure Dudes Choose Their Own Bridge (17:00) - The Sexy Story Scale (22:20) - Cool Factor and the Negative Control (28:10) - Grim Reaper Math (35:45) - T-Tests, Chi-Squares, and Shaky Results (42:00) - Electric Shocks and Damsels in Distress (49:30) - Replications and Rejections (57:20) - Wrap-Up, Methodological Morals, and a New Sexy Rating Scale | 1h 03m 13s | ||||||
| 10/6/25 | 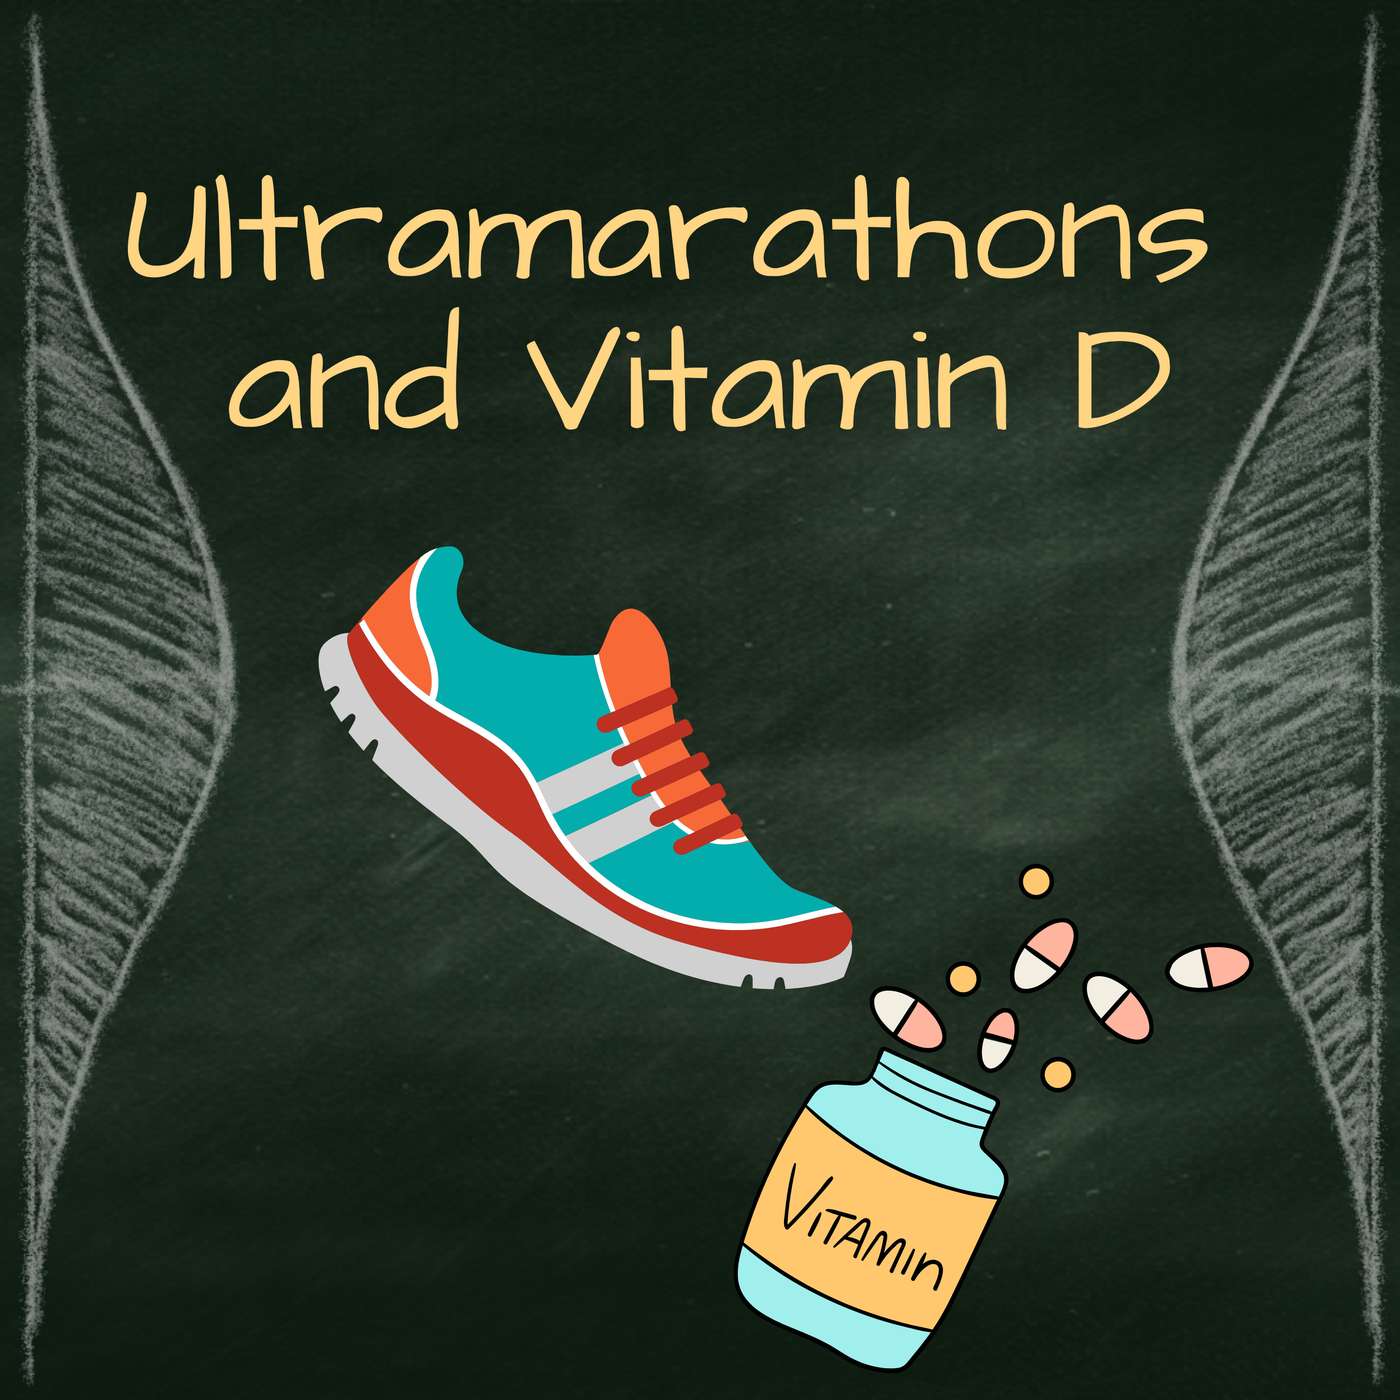 Ultramarathons: Can vitamin D protect your bones? | Ultramarathoners push their bodies to the limit, but can a giant pre-race dose of vitamin D really keep their bones from breaking down? In this episode, we dig into a trial that tested this claim – and found a statistical endurance event of its own: six highly interchangeable papers sliced from one small study. Expect missing runners, recycled figures, and a peer-review that reads like stand-up comedy, plus a quick lesson in using degrees of freedom as your statistical breadcrumbs.Statistical topicsData cleaning and validationDegrees of freedomExploratory vs confirmatory analysisFalse positives and Type I errorIntention-to-treat principleMultiple testingOpen data and transparencyP-hackingSalami slicingParametric vs non-parametric testsPeer review qualityRandomized controlled trialsResearch reproducibilityStatistical sleuthingMethodological morals“Degrees of freedom are the breadcrumbs in statistical sleuthing. They reveal the sample size even when the authors do not.”“Publishing the same study again and again with only the outcomes swapped is Mad Libs Science, better known as salami slicing.”ReferencesBoswell, Rachel. Pre-race vitamin D could do wonders for ultrarunners’ bone health, according to science. Runner’s World. September 25, 2025. Mieszkowski J, Stankiewicz B, Kochanowicz A, et al. Ultra-Marathon-Induced Increase in Serum Levels of Vitamin D Metabolites: A Double-Blind Randomized Controlled Trial. Nutrients. 2020;12(12):3629. Published 2020 Nov 25. doi:10.3390/nu12123629Mieszkowski J, Borkowska A, Stankiewicz B, et al. Single High-Dose Vitamin D Supplementation as an Approach for Reducing Ultramarathon-Induced Inflammation: A Double-Blind Randomized Controlled Trial. Nutrients. 2021;13(4):1280. Published 2021 Apr 13. doi:10.3390/nu13041280Mieszkowski J, Brzezińska P, Stankiewicz B, et al. Direct Effects of Vitamin D Supplementation on Ultramarathon-Induced Changes in Kynurenine Metabolism. Nutrients. 2022;14(21):4485. Published 2022 Oct 25. doi:10.3390/nu14214485Mieszkowski J, Brzezińska P, Stankiewicz B, et al. Vitamin D Supplementation Influences Ultramarathon-Induced Changes in Serum Amino Acid Levels, Tryptophan/Branched-Chain Amino Acid Ratio, and Arginine/Asymmetric Dimethylarginine Ratio. Nutrients. 2023;15(16):3536. Published 2023 Aug 11. doi:10.3390/nu15163536Stankiewicz B, Mieszkowski J, Kochanowicz A, et al. Effect of Single High-Dose Vitamin D3 Supplementation on Post-Ultra Mountain Running Heart Damage and Iron Metabolism Changes: A Double-Blind Randomized Controlled Trial. Nutrients. 2024;16(15):2479. Published 2024 Jul 31. doi:10.3390/nu16152479Stankiewicz B, Kochanowicz A, et al. Single high-dose vitamin D supplementation impacts ultramarathon-induced changes in serum levels of bone turnover markers: a double-blind randomized controlled trial. J Int Soc Sports Nutr. 2025 Dec;22(1):2561661. doi: 10.1080/15502783.2025.2561661.Kristin and Regina’s online courses: Demystifying Data: A Modern Approach to Statistical Understanding Clinical Trials: Design, Strategy, and Analysis Medical Statistics Certificate Program Writing in the Sciences Epidemiology and Clinical Research Graduate Certificate Program Programs that we teach in:Epidemiology and Clinical Research Graduate Certificate Program Find us on:Kristin - LinkedIn & Twitter/XRegina - LinkedIn & ReginaNuzzo.com 00:00 Intro & claim of the episode 00:44 Runner’s World headline: Vitamin D for ultramarathoners 02:03 Kristin’s connection to running and vitamin D skepticism 03:32 Ultramarathon world—Regina’s stories and Death Valley race 06:29 What ultramarathons do to your bones 08:02 Boy story: four stress fractures in one race 10:00 Study design—40 male runners in Poland 11:33 Missing flow diagram and violated intention-to-treat 13:02 The intervention: 150,000 IU megadose 15:09 Blinding details and missing randomization info 17:13 Measuring bone biomarkers—no primary outcome specified 19:12 The wrong clinicaltrials.gov registration 20:35 Discovery of six papers from one dataset (salami slicing) 23:02 Why salami slicing misleads readers 25:42 Inconsistent reporting across papers 29:11 Changing inclusion criteria and sloppy methods 31:06 Typos, Polish notes, and misnumbered references 32:39 Peer review comedy gold—“Please define vitamin D” 36:06 Reviewer laziness and p-hacking admission 39:13 Results: implausible bone growth mid-race 41:16 Degrees of freedom sleuthing reveals hidden sample sizes 47:07 Open data? Kristin emails the authors 48:42 Lessons from Kristin’s own ultramarathon dataset 51:22 Fishing expeditions and misuse of parametric tests 53:07 Strength of evidence: one smooch each 54:44 Methodologic morals—Mad Libs Science & degrees of freedom breadcrumbs 56:12 Anyone can spot red flags—trust your eyes 57:34 Outro: skip the vitamin D shot before your next run | 57m 55s | ||||||
| 9/22/25 | 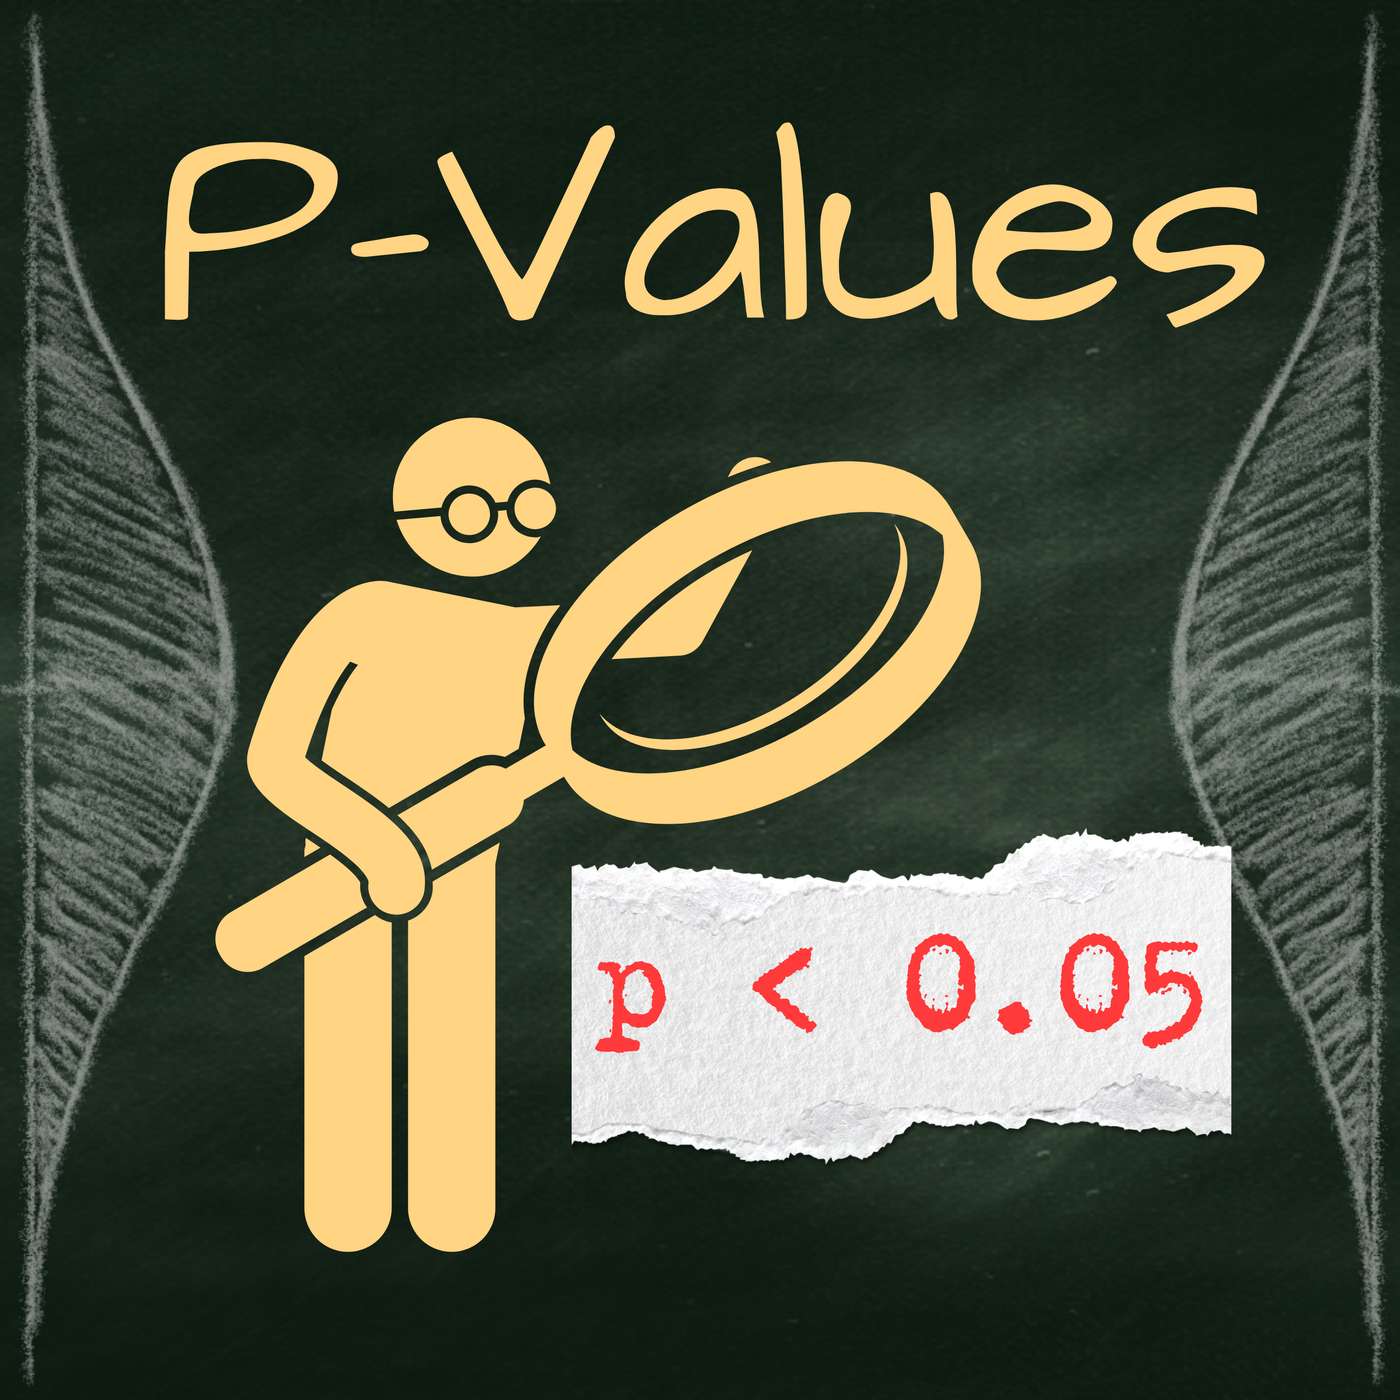 P-Values: Are we using a flawed statistical tool? | P-values show up in almost every scientific paper, yet they’re one of the most misunderstood ideas in statistics. In this episode, we break from our usual journal-club format to unpack what a p-value really is, why researchers have fought about it for a century, and how that famous 0.05 cutoff became enshrined in science. Along the way, we share stories from our own papers—from a Nature feature that helped reshape the debate to a statistical sleuthing project that uncovered a faulty method in sports science. The result: a behind-the-scenes look at how one statistical tool has shaped the culture of science itself.Statistical topicsBayesian statisticsConfidence intervals Effect size vs. statistical significanceFisher’s conception of p-valuesFrequentist perspectiveMagnitude-Based Inference (MBI)Multiple testing / multiple comparisonsNeyman-Pearson hypothesis testing frameworkP-hackingPosterior probabilitiesPreregistration and registered reportsPrior probabilitiesP-valuesResearcher degrees of freedomSignificance thresholds (p < 0.05)Simulation-based inferenceStatistical power Statistical significanceTransparency in research Type I error (false positive)Type II error (false negative)Winner’s CurseMethodological morals“If p-values tell us the probability the null is true, then octopuses are psychic.”“Statistical tools don't fool us, blind faith in them does.”ReferencesNuzzo R. Scientific method: statistical errors. Nature. 2014 Feb 13;506(7487):150-2. doi: 10.1038/506150a. Nuzzo, R., 2015. Scientists perturbed by loss of stat tools to sift research fudge from fact. Scientific American, pp.16-18.Nuzzo RL. The inverse fallacy and interpreting P values. PM&R. 2015 Mar;7(3):311-4. doi: 10.1016/j.pmrj.2015.02.011. Epub 2015 Feb 25. Nuzzo, R., 2015. Probability wars. New Scientist, 225(3012), pp.38-41.Sainani KL. Putting P values in perspective. PM&R. 2009 Sep;1(9):873-7. doi: 10.1016/j.pmrj.2009.07.003.Sainani KL. Clinical versus statistical significance. PM&R. 2012 Jun;4(6):442-5. doi: 10.1016/j.pmrj.2012.04.014.McLaughlin MJ, Sainani KL. Bonferroni, Holm, and Hochberg corrections: fun names, serious changes to p values. PM&R. 2014 Jun;6(6):544-6. doi: 10.1016/j.pmrj.2014.04.006. Epub 2014 Apr 22. Sainani KL. The Problem with "Magnitude-based Inference". Med Sci Sports Exerc. 2018 Oct;50(10):2166-2176. doi: 10.1249/MSS.0000000000001645. Sainani KL, Lohse KR, Jones PR, Vickers A. Magnitude-based Inference is not Bayesian and is not a valid method of inference. Scand J Med Sci Sports. 2019 Sep;29(9):1428-1436. doi: 10.1111/sms.13491. Lohse KR, Sainani KL, Taylor JA, Butson ML, Knight EJ, Vickers AJ. Systematic review of the use of "magnitude-based inference" in sports science and medicine. PLoS One. 2020 Jun 26;15(6):e0235318. doi: 10.1371/journal.pone.0235318. Wasserstein, R.L. and Lazar, N.A., 2016. The ASA statement on p-values: context, process, and purpose. The American Statistician, 70(2), pp.129-133.Kristin and Regina’s online courses: Demystifying Data: A Modern Approach to Statistical Understanding Clinical Trials: Design, Strategy, and Analysis Medical Statistics Certificate Program Writing in the Sciences Epidemiology and Clinical Research Graduate Certificate Program Programs that we teach in:Epidemiology and Clinical Research Graduate Certificate Program Find us on:Kristin - LinkedIn & Twitter/XRegina - LinkedIn & ReginaNuzzo.com(00:00) - Intro & claim of the episode (01:00) - Why p-values matter in science (02:44) - What is a p-value? (ESP guessing game) (06:47) - Big vs. small p-values (psychic octopus example) (08:29) - Significance thresholds and the 0.05 rule (09:00) - Regina’s Nature paper on p-values (11:32) - Misconceptions about p-values (13:18) - Fisher vs. Neyman-Pearson (history & feud) (16:26) - Botox analogy and type I vs. type II errors (19:41) - Dating app analogies for false positives/negatives (22:02) - How the 0.05 cutoff got enshrined (23:46) - Misinterpretations: statistical vs. practical significance (25:22) - Effect size, sample size, and “statistically discernible” (25:51) - P-hacking and researcher degrees of freedom (28:52) - Transparency, preregistration, and open science (29:58) - The 0.05 cutoff trap (p = 0.049 vs 0.051) (30:24) - The biggest misinterpretation: what p-values actually mean (32:35) - Paul the psychic octopus (worked example) (35:05) - Why Bayesian statistics differ (38:55) - Why aren’t we all Bayesian? (probability wars) (40:11) - The ASA p-value statement (behind the scenes) (42:22) - Key principles from the ASA white paper (43:21) - Wrapping up Regina’s paper (44:39) - Kristin’s paper on sports science (MBI) (47:16) - What MBI is and how it spread (49:49) - How Kristin got pulled in (Christie Aschwanden & FiveThirtyEight) (53:11) - Critiques of MBI and “Bayesian monster” rebuttal (55:20) - Spreadsheet autopsies (Welsh & Knight) (57:11) - Cherry juice example (why MBI misleads) (59:28) - Rebuttals and smoke & mirrors from MBI advocates (01:02:01) - Winner’s Curse and small samples (01:02:44) - Twitter fights & “establishment statistician” (01:05:02) - Cult-like following & Matrix red pill analogy (01:07:12) - Wrap-up | 1h 13m 26s | ||||||
| 9/8/25 | 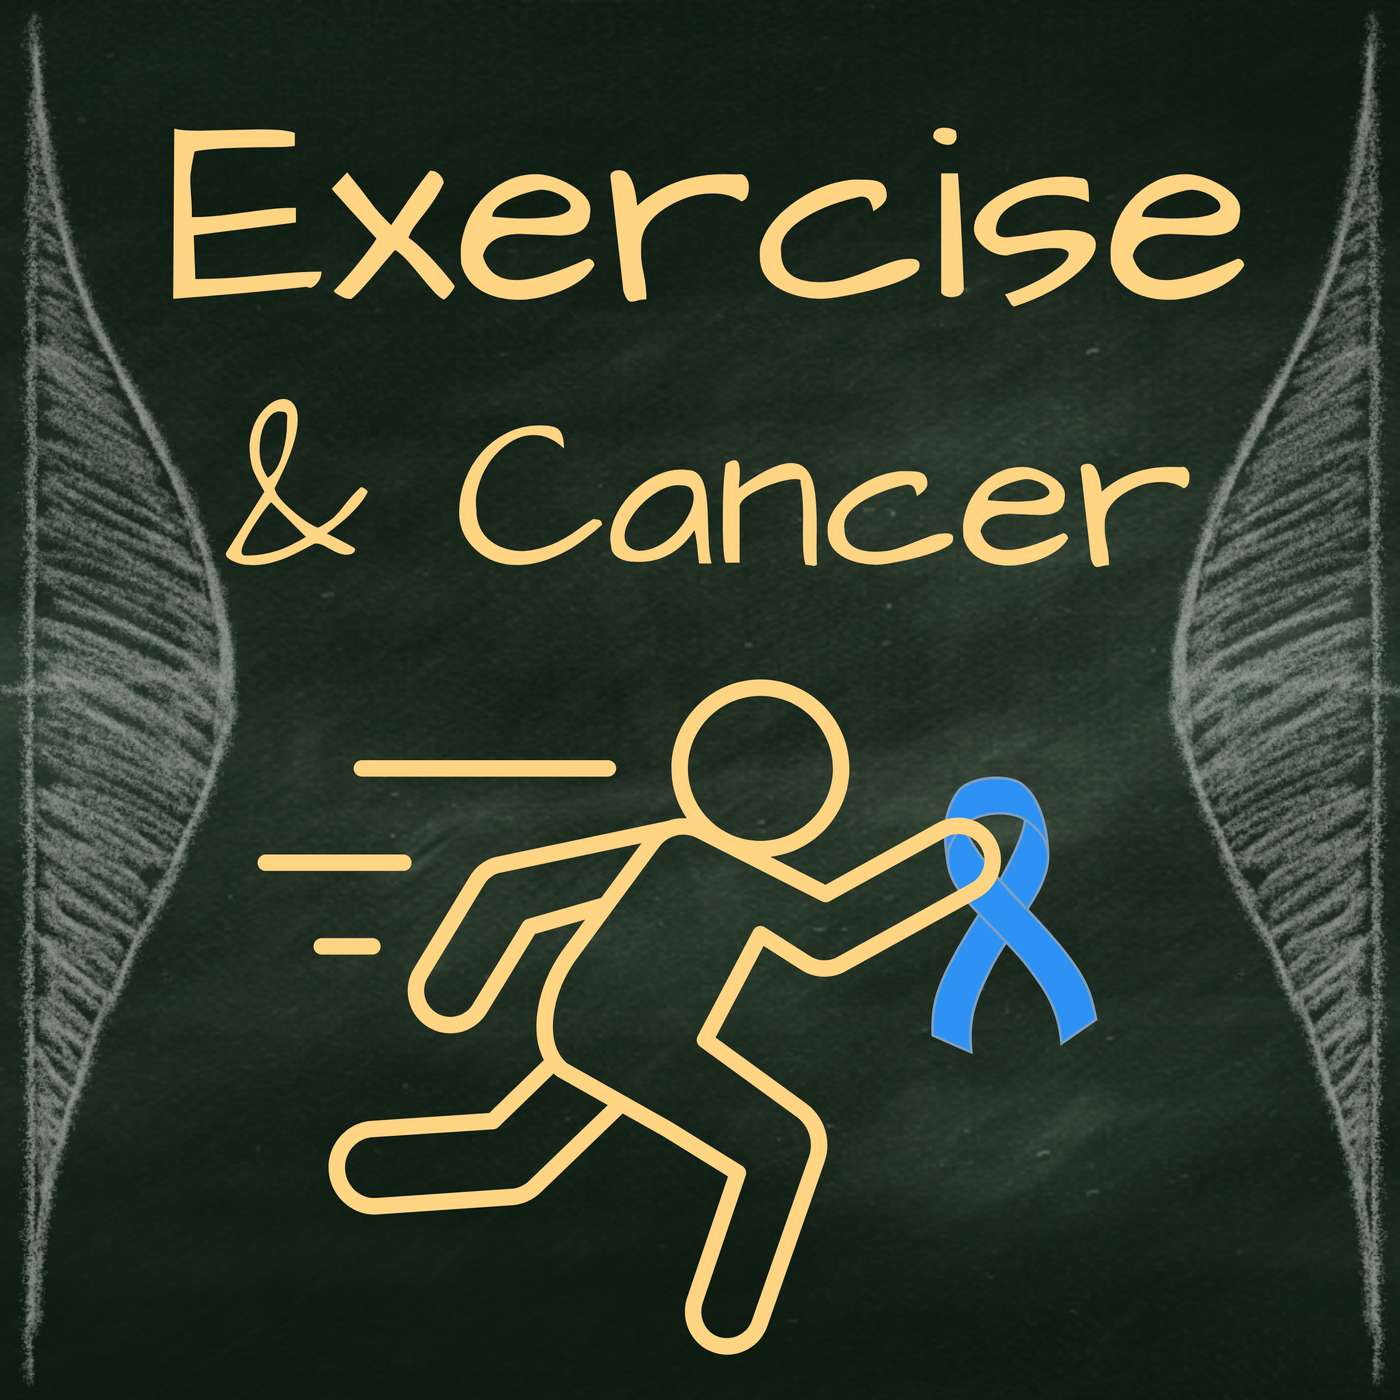 Exercise and Cancer: Does physical activity improve colon cancer survival? | Exercise has long been hailed as cancer-fighting magic, but is there hard evidence behind the hype? In this episode, we tackle the CHALLENGE trial, a large phase III study of colon cancer patients that tested whether prescribed exercise could improve cancer-free survival. We translate clinical jargon into plain English, show why ratio statistics make splashy headlines while absolute differences tell the real story, and take a detour into why statisticians think survival analysis is downright sexy. And we even bring in a classic reality show to make sense of the numbers.Statistical topicsData and Safety Monitoring Board (DSMB)Hazard ratiosIntention-to-treat analysisInterim analysesKaplan-Meier curvesPhase III trialsRandomized clinical trialRates and rate ratiosRelative vs absolute differencesStratified randomization with minimizationSurvival analysisTime-to-event variablesMethodological morals“Ratio statistics sell headlines. Absolute differences sell truth.”“Survival analysis is this sexy stats tool that makes every moment and every Cox count.”ReferencesCourneya KS, Vardy JL, O'Callaghan CJ, et al. Structured Exercise after Adjuvant Chemotherapy for Colon Cancer. NEJM. 2025;393:13-25. Rabin RC. Are Marathons and Extreme Running Linked to Colon Cancer? The New York Times. Aug 19, 2025.Sainani KL. Introduction to survival analysis. PM&R. 2016; 8:580-85.Sainani KL. Making sense of intention-to-treat. PM&R. 2010;2:209-13.ThanksThanks to Caitlin Goodrich for the episode topic tip!Kristin and Regina’s online courses: Demystifying Data: A Modern Approach to Statistical Understanding Clinical Trials: Design, Strategy, and Analysis Medical Statistics Certificate Program Writing in the Sciences Epidemiology and Clinical Research Graduate Certificate Program Programs that we teach in:Epidemiology and Clinical Research Graduate Certificate Program Find us on:Kristin - LinkedIn & Twitter/XRegina - LinkedIn & ReginaNuzzo.com(00:00) - Intro (05:42) - Two different types of cancer studies (08:12) - Why might exercise affect cancer? (10:05) - Phase III trials are different (12:40) - Who was in the CHALLENGE trial? (13:31) - Stratified randomization with minimization (15:05) - The exercise prescription (18:23) - What did the CHALLENGE trial measure? (19:10) - Disease-free survival (21:05) - Data and Safety Monitoring Board – what do they do? (23:41) - Participants and adherence to exercise (26:00) - Intention-to-treat analysis (29:04) - Survival analysis overview (30:57) - Kaplan-Meier curves (33:33) - Reality-show analogy (36:00) - Ratio statistics are confusing (38:36) - Hazard ratios (46:09) - Wrap-up, rating, and methodological morals | 49m 04s | ||||||
| 8/25/25 | 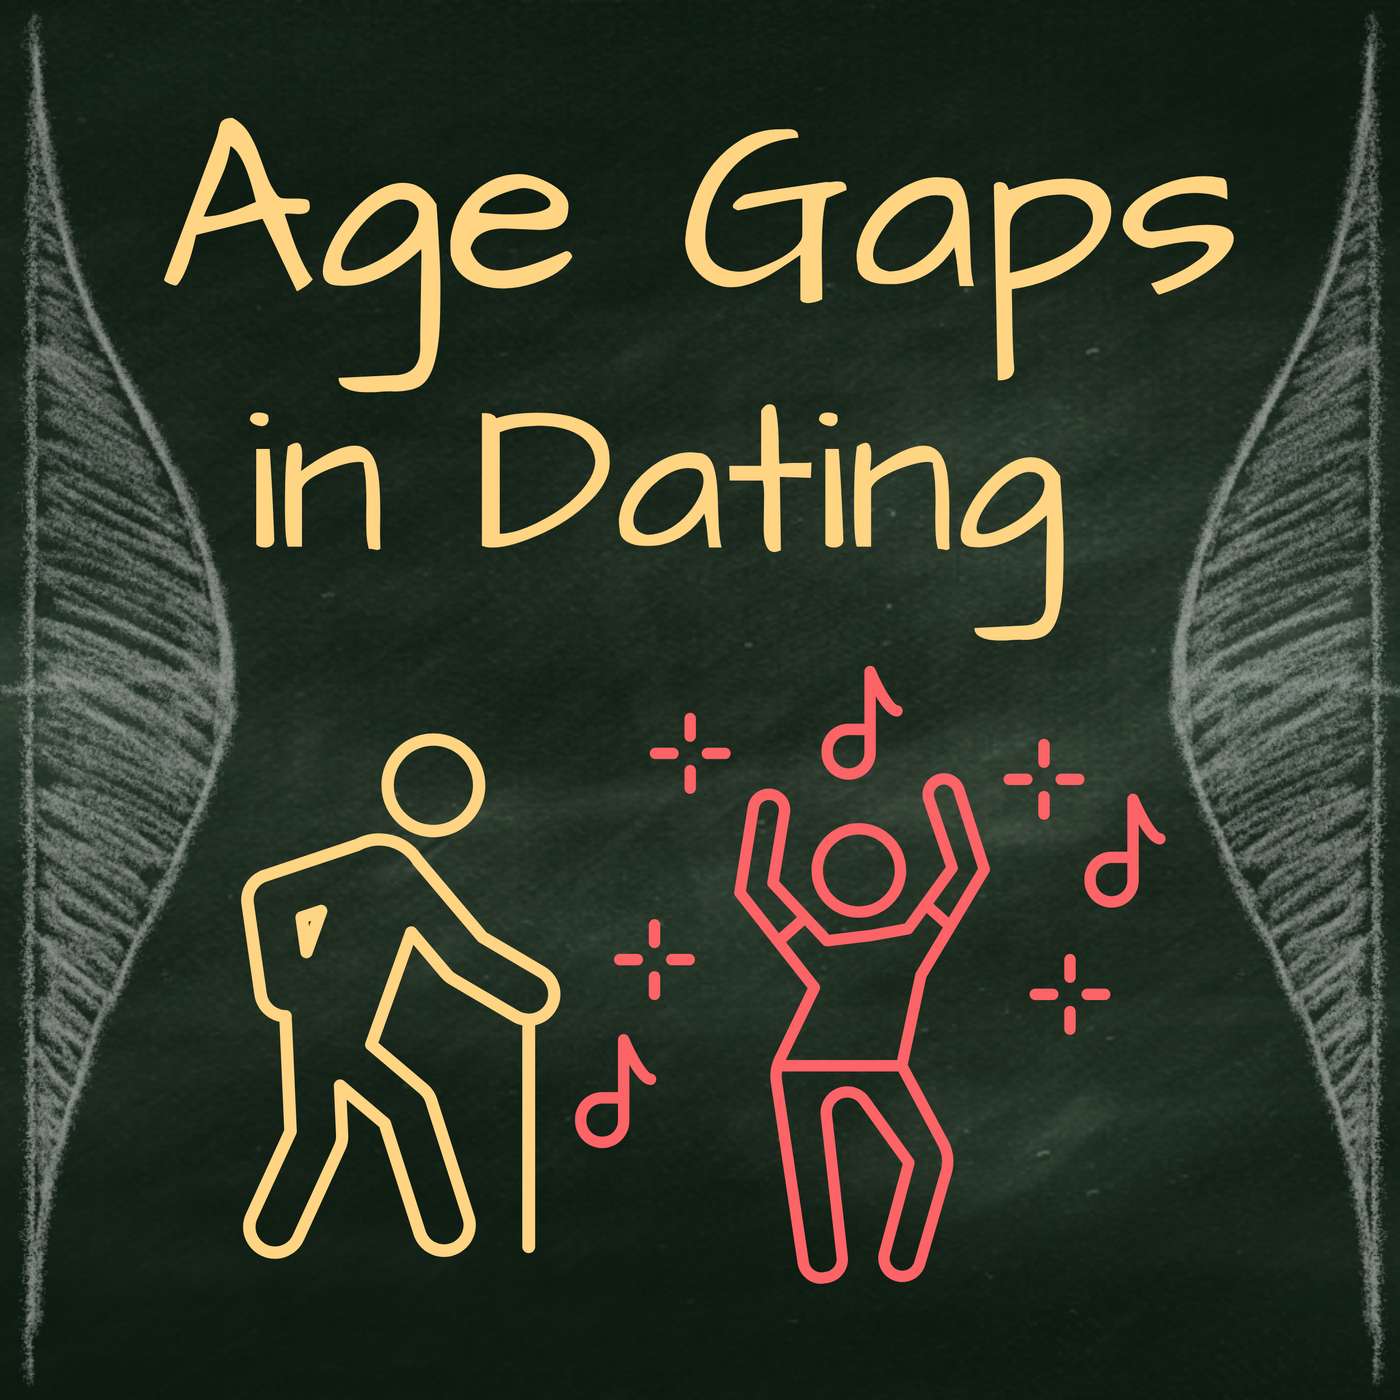 Age Gaps: How much does age matter in dating? | Are we all secretly ageist when it comes to dating? We put the stereotype that older men prefer younger women under the microscope using data from thousands of blind dates. What we found surprised us: the “age penalty” was real but microscopic, women wanted younger partners too, and hard age cutoffs weren’t so hard after all. Along the way, we unpack statistical significance versus practical importance, play with the infamous “half your age plus seven” rule, and imagine what it would take for love to die out… somewhere around age 628.Statistical topicsDiscontinuous regressionEffect sizesExtrapolation pitfallsLinear regressionLogistic regressionOdds ratiosOpen dataStatistical significance vs. practical significanceMethodological morals“Do not be swept off your feet by statistical significance. Tiny effects in bed are still tiny.”“Fancy units sound smart, but plain English wins hearts.”Show Notes Technical Appendix (with step-by-step explanations)ReferencesEastwick PW, Finkel EJ, Meza EM, Ammerman K. No gender differences in attraction to young partners: A study of 4500 blind dates. Proc Natl Acad Sci U S A. 2025 Feb 4;122(5):e2416984122. Matchmaking Dataset and Code on Open Science Framework: https://osf.io/rkm2d/?view_only=a0fe91dae0464077af7772e6890a8151Nuzzo RL. Communicating measures of relative risk in plain English. PM&R. 2022 Feb;14(2):283-7.O'Rell, Max. Her Royal Highness, Woman: And His Majesty--Cupid. Abbey Press, 1901.Sainani KL. Logistic regression. PM&R. 2014 Dec;6(12):1157-62.Sainani KL. Understanding odds ratios. PM&R. 2011 Mar;3:263-7. Sainani KL. Clinical versus statistical significance. PM&R. 2012 Jun;4:442-5.Kristin and Regina’s online courses: Demystifying Data: A Modern Approach to Statistical Understanding Clinical Trials: Design, Strategy, and Analysis Medical Statistics Certificate Program Writing in the Sciences Epidemiology and Clinical Research Graduate Certificate Program Programs that we teach in:Epidemiology and Clinical Research Graduate Certificate Program Find us on:Kristin - LinkedIn & Twitter/XRegina - LinkedIn & ReginaNuzzo.com(00:00) - Intro (04:01) - Half-your-age-plus-seven rule (09:15) - Matchmaking service for the study (17:05) - Blind dates as natural experiments (21:55) - Regression results part 1: Age penalties? (28:38) - Wait, how big of an effect was that? (34:09) - Odds ratio of a second date (38:01) - Surprising age pair-ups (40:53) - Regression results part 2: Deal-breaking age limits? (44:27) - Why the patterns may or may not be true (46:30) - Wrap-up, ratings, and methodological morals | 49m 42s | ||||||
| 8/11/25 | 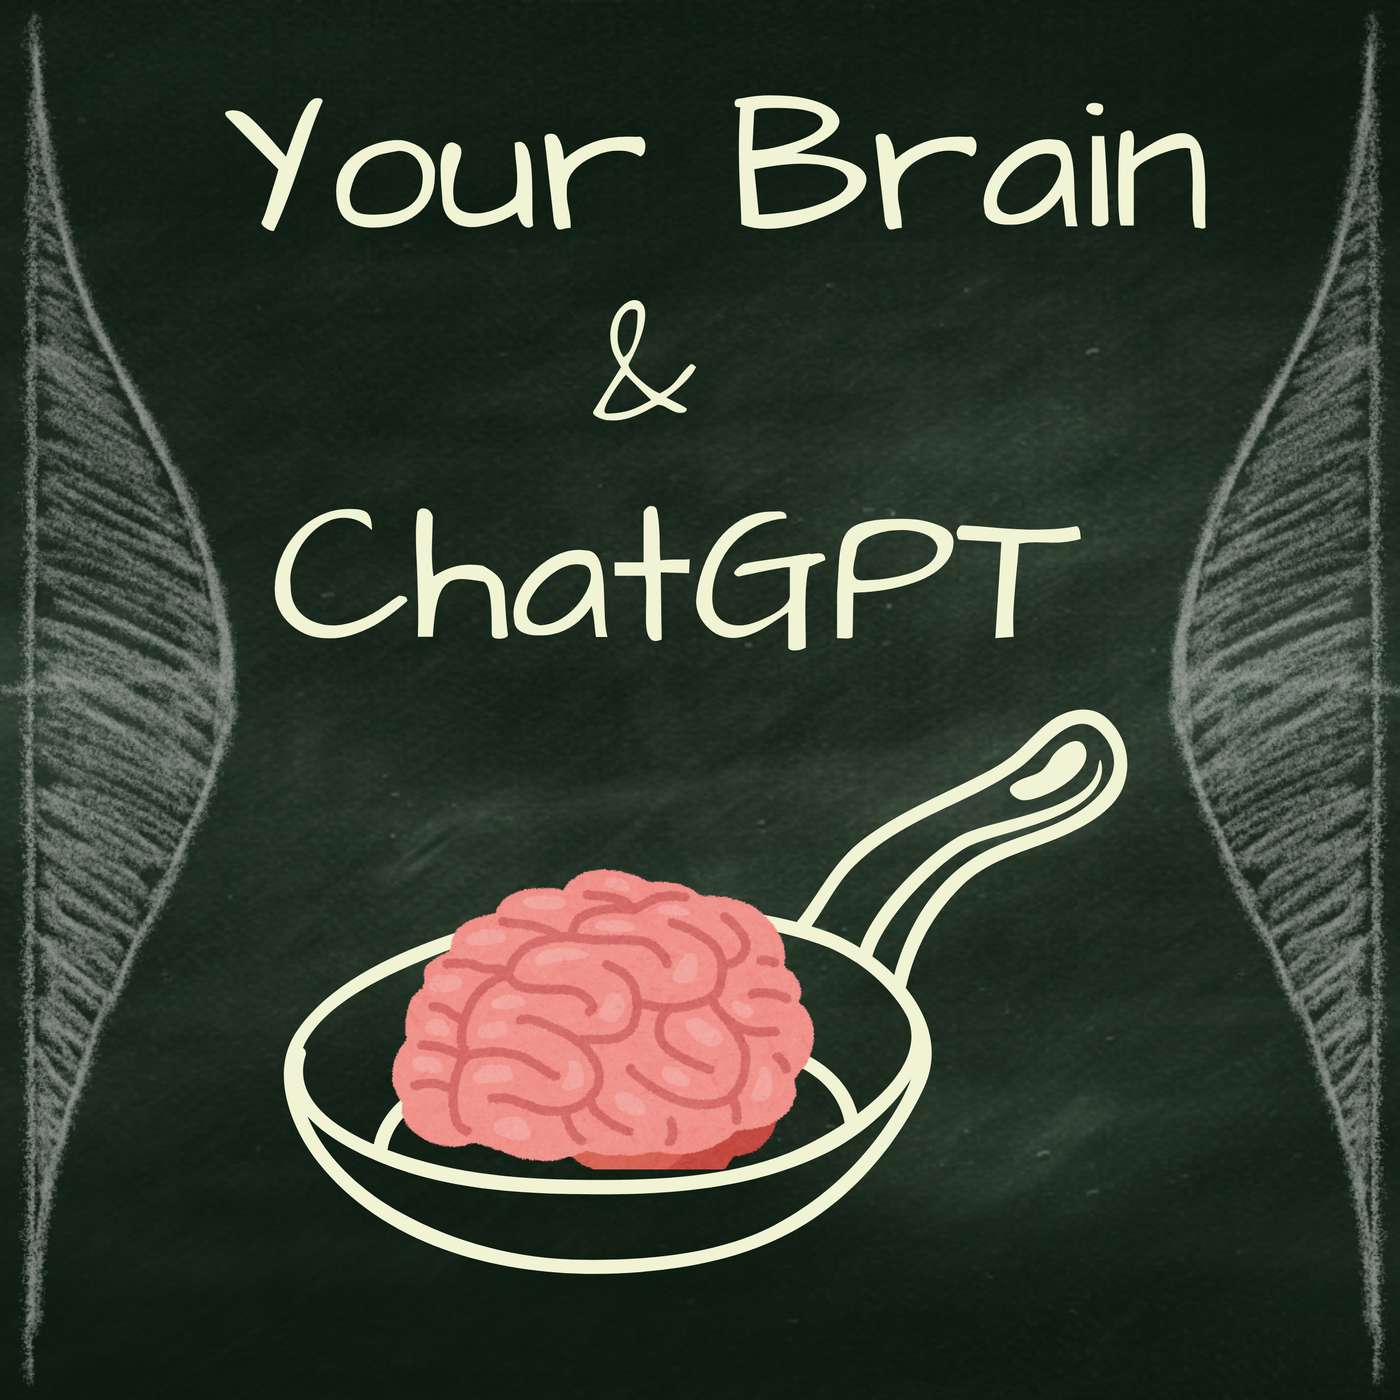 Your Brain on AI: Is ChatGPT making us mentally lazy? | ChatGPT is melting our brainpower, killing creativity, and making us soulless — or so the headlines imply. We dig into the study behind the claims, starting with quirky bar charts and mysterious sample sizes, then winding through hairball-like brain diagrams and tens of thousands of statistical tests. Our statistical sleuthing leaves us with questions, not just about the results, but about whether this was science’s version of a first date that looked better on paper.Statistical topicsANOVABar graphsData visualization False Discovery Rate correctionMultiple testingPreprintsStatistical SleuthingMethodological morals"Treat your preprints like your blind dates. Show up showered and with teeth brushed.""Always check your N. Then check it again.""Never make a bar graph that just shows p-values. Ever."Link to paperKristin and Regina’s online courses: Demystifying Data: A Modern Approach to Statistical Understanding Clinical Trials: Design, Strategy, and Analysis Medical Statistics Certificate Program Writing in the Sciences Epidemiology and Clinical Research Graduate Certificate ProgramPrograms that we teach in:Epidemiology and Clinical Research Graduate Certificate Program Find us on:Kristin - LinkedIn & Twitter/XRegina - LinkedIn & ReginaNuzzo.com(00:00) - Intro (03:46) - Media coverage of the study (08:35) - The experiment (12:09) - Sample size issues (13:11) - Bar chart sleuthing (19:15) - Blind date analogy (22:57) - Interview results (29:07) - Simple text analysis results (33:07) - Natural language processing results (40:03) - N-gram and ontology analysis results (44:58) - Teacher evaluation results (51:33) - Neuroimaging analysis (59:35) - Multiple testing and connectivity issues (01:05:13) - Brain adaptation results (01:08:50) - Wrap-up, rating, and methodological morals | 1h 14m 07s | ||||||
| 7/28/25 | 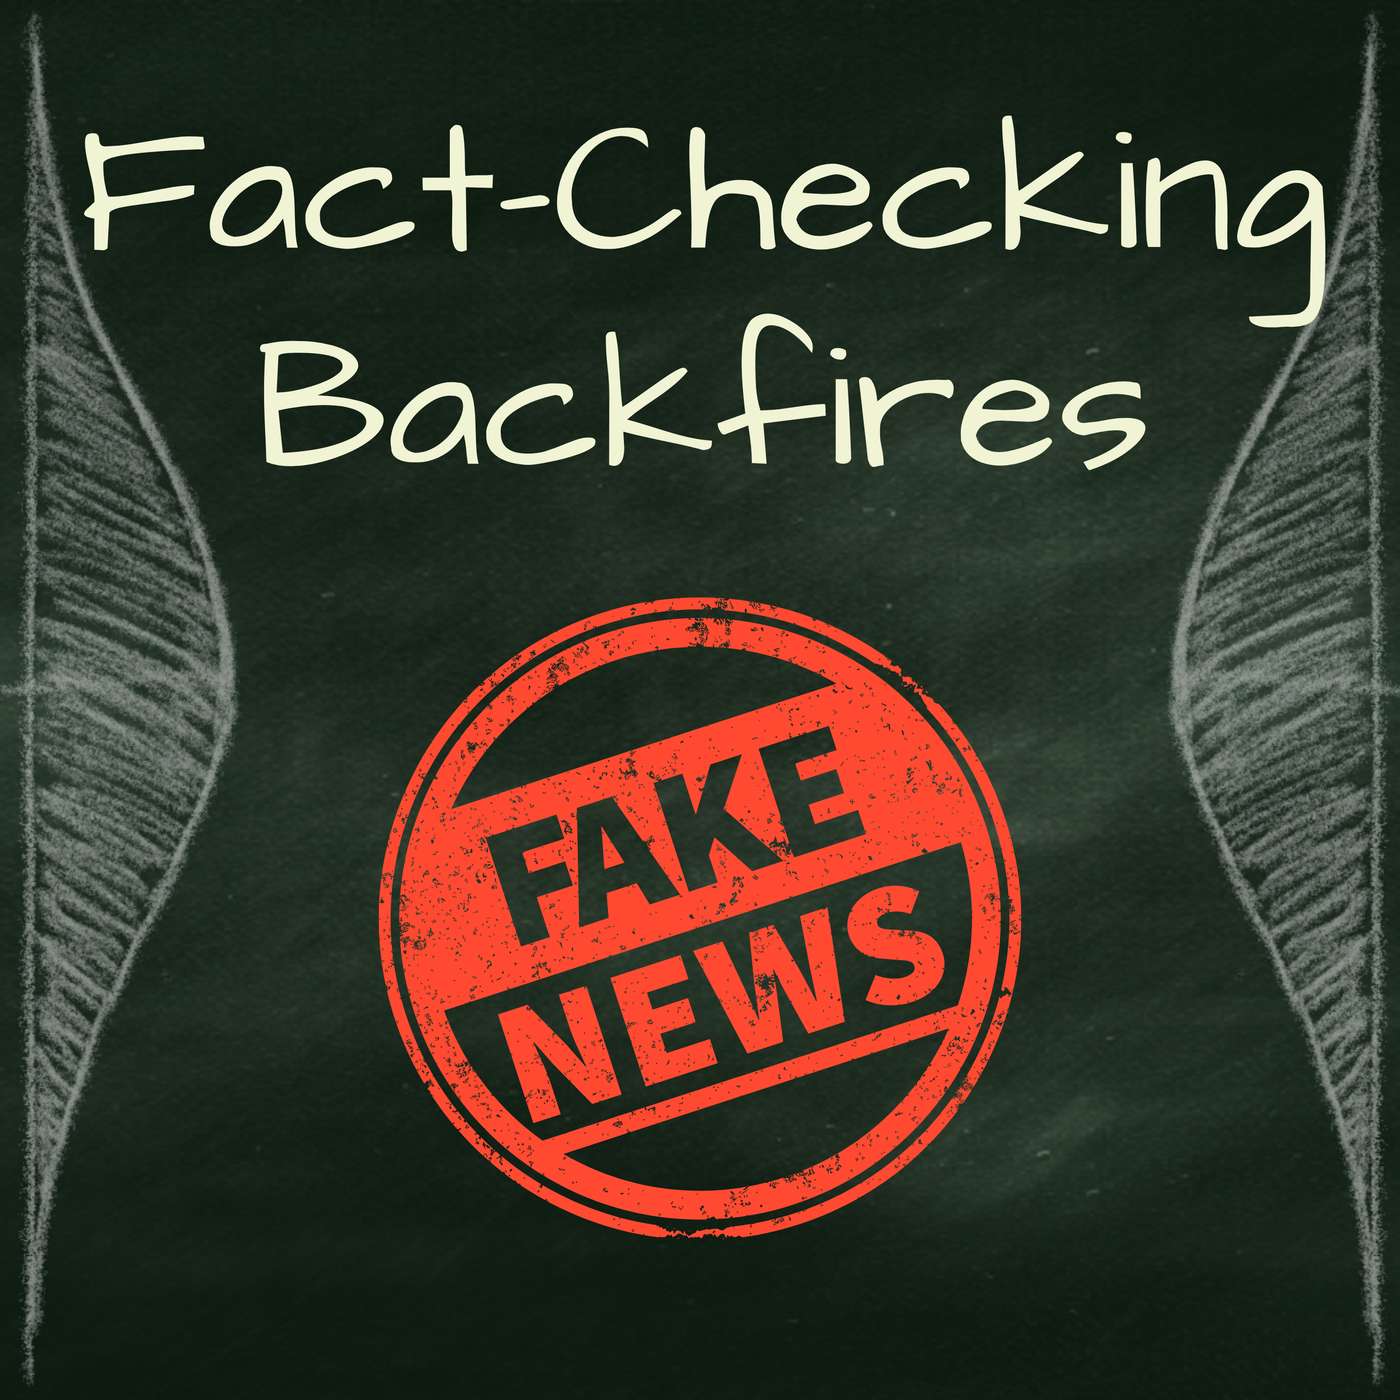 The Backfire Effect: Can fact-checking make false beliefs stronger? | Can correcting misinformation make it worse? The “backfire effect” claims that debunking myths can actually make false beliefs stronger. We dig into the evidence — from ghost studies to headline-making experiments — to see if this psychological plot twist really holds up. Along the way, we unpack interaction effects, randomization red flags, and what happens when bad citations take on a life of their own. Plus: dirty talk analogies, statistical sleuthing, and why “familiarity” might be your brain’s sneakiest trick.Statistical topicsComputational replicationReplicationBlock randomizationProblems in randomizationBad citingInteractions in regressionUnpublished "Ghost Paper"PDF retrieved from the Wayback MachineCitationsNyhan B, Reifler J. When corrections fail: The persistence of political misperceptions. Political Behavior. 2010;32:303–330.Skurnik I, Yoon C, Schwarz N. “Myths & Facts” about the flu: Health education campaigns can reduce vaccination intentions. Unpublished manuscript, PDF posted separately.Schwarz N, Sanna LJ, Skurnik I, et al. Metacognitive experiences and the intricacies of setting people straight: Implications for debiasing and public information campaigns. Advances in Experimental Social Psychology. 2007;39:127–61.Lewandowsky S, Ecker UKH, Seifert CM, et al. Misinformation and its correction: Continued influence and successful debiasing. Psychological Science in the Public Interest. 2012;13:106–131.Pluviano S, Watt C, Della Sala S. Misinformation lingers in memory: Failure of three pro-vaccination strategies. PLOS ONE. 2017;12:e0181640.Pluviano S, Watt C, Ragazzini G, et al. Parents’ beliefs in misinformation about vaccines are strengthened by pro‑vaccine campaigns. Cognitive Processing. 2019;20:325–31.Wood T, Porter E. The elusive backfire effect: Mass attitudes’ steadfast factual adherence. Political Behavior. 2019;41:135–63.Nyhan B, Porter E, Reifler J, Wood TJ. Taking fact-checks literally but not seriously? The effects of journalistic fact-checking on factual beliefs and candidate favorability. Political Behavior. 2020;42:939–60.Ecker UKH, Hogan JL, Lewandowsky S. Reminders and repetition of misinformation: Helping or hindering its retraction? Journal of Applied Research in Memory and Cognition. 2017;6:185–92.Swire B, Ecker UKH, Lewandowsky S. The role of familiarity in correcting inaccurate information. Journal of Experimental Psychology: Learning, Memory, and Cognition. 2017;43:1948–61.Ecker UKH, O’Donnell M, Ang LC, et al. The effectiveness of short- and long-format retractions on misinformation belief and recall. British Journal of Psychology. 2020;111:36–54.Ecker UKH, Sharkey CXM, Swire-Thompson B. Correcting vaccine misinformation: A failure to replicate familiarity or fear-driven backfire effects. PLOS ONE. 2023;18:e0281140.Cook J, Lewandowsky S. The Debunking Handbook. University of Queensland. 2011.Lewandowsky S, Cook J, Ecker UKH, et al. The Debunking Handbook 2020. Available at https://sks.to/db2020. Swire‑Thompson B, DeGutis J, Lazer D. Searching for the backfire effect: Measurement and design considerations. Journal of Applied Research in Memory and Cognition. 2020;9:286–99.Kristin and Regina’s online courses: Demystifying Data: A Modern Approach to Statistical Understanding Clinical Trials: Design, Strategy, and Analysis Medical Statistics Certificate Program Writing in the Sciences Epidemiology and Clinical Research Graduate Certificate Program Programs that we teach in:Epidemiology and Clinical Research Graduate Certificate Program Find us on:Kristin - LinkedIn & Twitter/XRegina - LinkedIn & ReginaNuzzo.com(00:00) - (00:00) - Intro (02:05) - What is the backfire effect? (03:55) - The 2010 paper that panicked fact-checkers (06:25) - The ghost paper what it really said (12:35) - Study design of the 2010 paper (18:25) - Results of the 2010 paper (19:55) - Crossover interactions, regression models, and intimate talk (25:24) - Missing data and cleaning your bedroom analogy (28:11) - Fact-checking the fact-checking paper (33:07) - Replication and pushing the data to the limit (36:59) - The purported backfire effect spreads (41:06) - The 2017 paper that got a lot of attention (44:25) - Statistical sleuthing the 2017 paper (48:51) - Will researchers double down on their earlier conclusions? (54:46) - A review paper sums it all up (56:00) - Wrap up, rating, and methodological morals | 58m 26s | ||||||
Showing 25 of 38
Pitch Fit is a Pro feature
See how bookable this show is for guests, which brands already advertise, the per-episode ad value, and the best-fit guest and sponsor profile. The numbers are blurred on the free plan.
How readily this show books outside guests like you.
How proven this show is for host-read sponsorships.
For Guests
ProFor Advertisers
ProUpgrade to Pro to unlock guest cadence, sponsor categories, fit scores, and per-episode ad value for this show.
Chart Positions
7 placements across 7 markets.
Chart Positions
7 placements across 7 markets.