
Insights from recent episode analysis
Audience Interest
Podcast Focus
Publishing Consistency
Platform Reach
Insights are generated by CastFox AI using publicly available data, episode content, and proprietary models.
Most discussed topics
Brands & references
Est. Listeners
Insufficient chart data. Estimates will improve as the show charts.
- Per-Episode Audience
Est. listeners per new episode within ~30 days
N/A🎙 Weekly cadence·97 episodes·Last published today - Monthly Reach
Unique listeners across all episodes (30 days)
N/A - Active Followers
Loyal subscribers who consistently listen
N/A
Market Insights
Platform Distribution
Reach across major podcast platforms, updated hourly
Total Followers
—
Total Plays
—
Total Reviews
—
* Data sourced directly from platform APIs and aggregated hourly across all major podcast directories.
On the show
From 12 epsHosts
Recent guests
Recent episodes
help! my data story feels boring
Jul 8, 2026
Unknown duration
how to teach data storytelling
Jul 1, 2026
Unknown duration
storytelling with data podcast: #100 the best episodes we’d send to a friend
Jun 25, 2026
Unknown duration
storytelling with data podcast: #99 learn to love critique (even if you’re sensitive)
Jun 2, 2026
59m 20s
storytelling with data podcast: #98 how to overcome your presentation challenges
May 6, 2026
1h 07m 19s
Social Links & Contact
Official channels & resources
Official Website
Login
RSS Feed
Login
| Date | Episode | Topics | Guests | Brands | Places | Keywords | Sponsor | Length | |
|---|---|---|---|---|---|---|---|---|---|
| 7/8/26 | 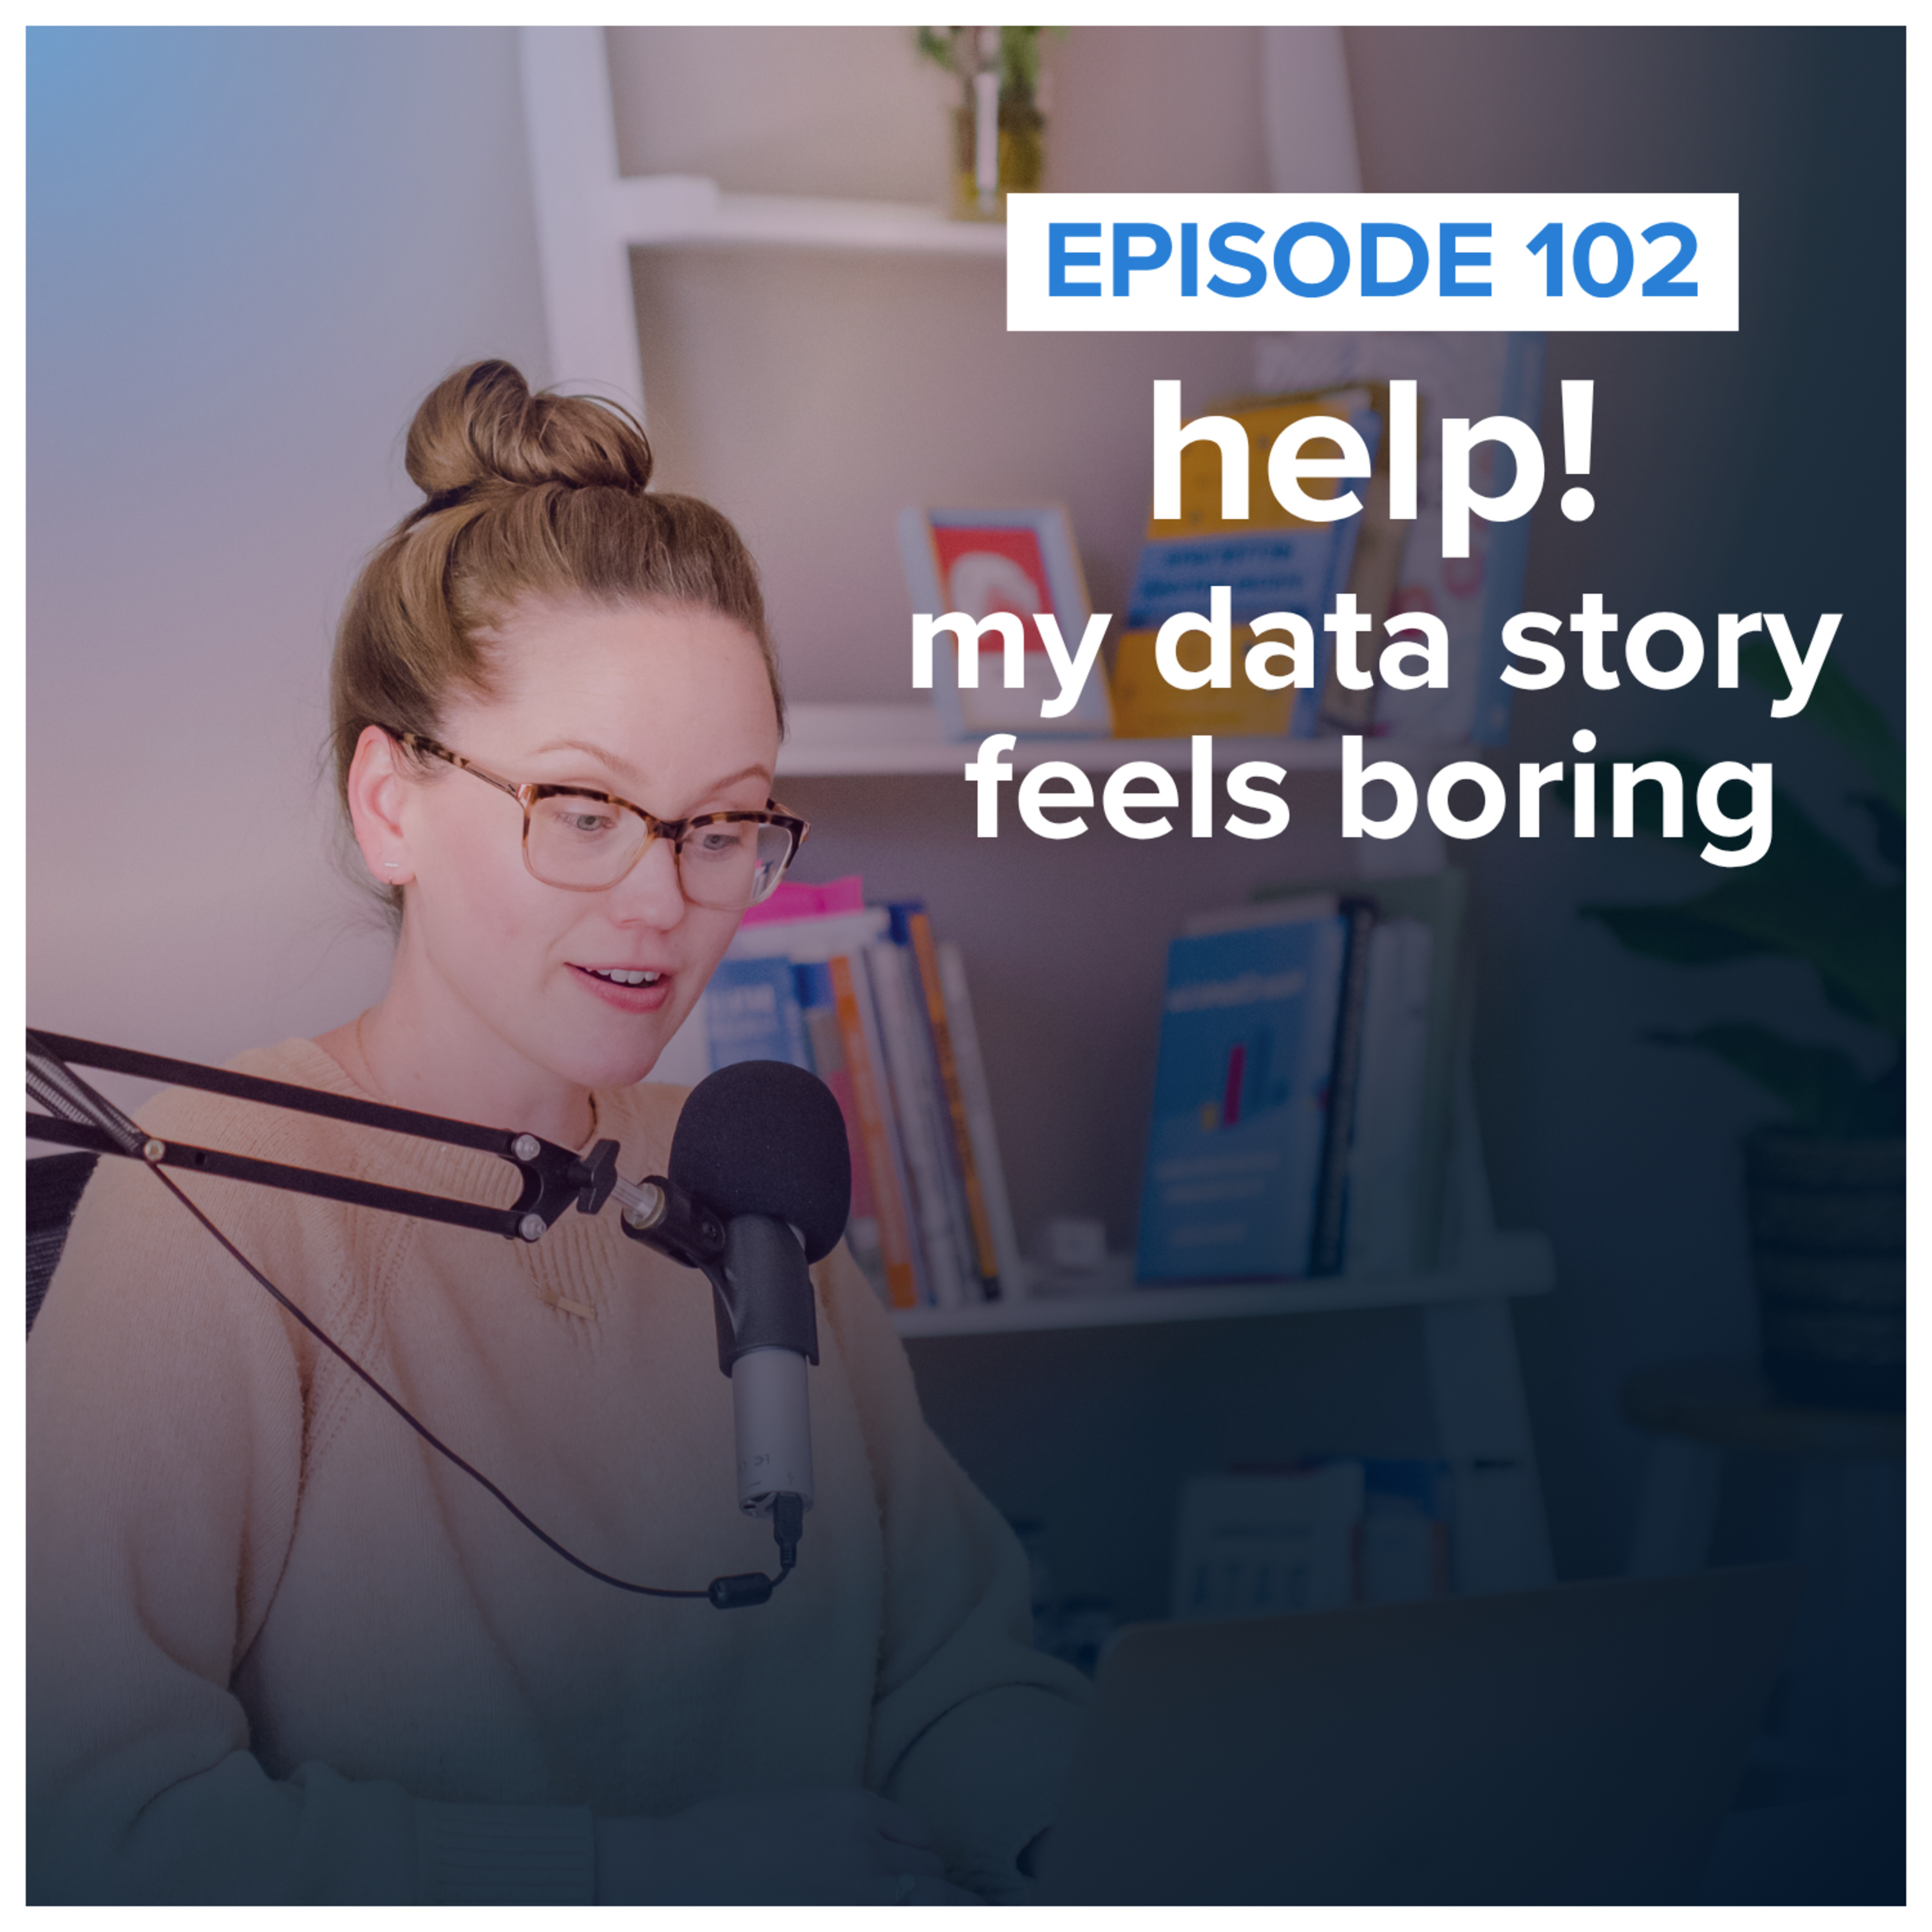 help! my data story feels boring | Can "nothing changed" still be a compelling data story?Join data storyteller Alli Torban as she shares why "everything is performing as expected" can still be a meaningful data story. Through three examples from the storytelling with data community, you'll learn practical techniques for making "normal" meaningful by establishing expectations, adding helpful context, and giving your audience confidence to make a decision—even when there isn't a dramatic insight hiding in the data.LINKSShow notesThe storytelling with data bookJoin the SWD communitySteven’s submissionRobyn’s submissionGian’s submissionWatch our free AI virtual event LIVE on July 13th, 2026Register for the 4-hour, public workshop on August 20th, 2026 | — | ||||||
| 7/1/26 | 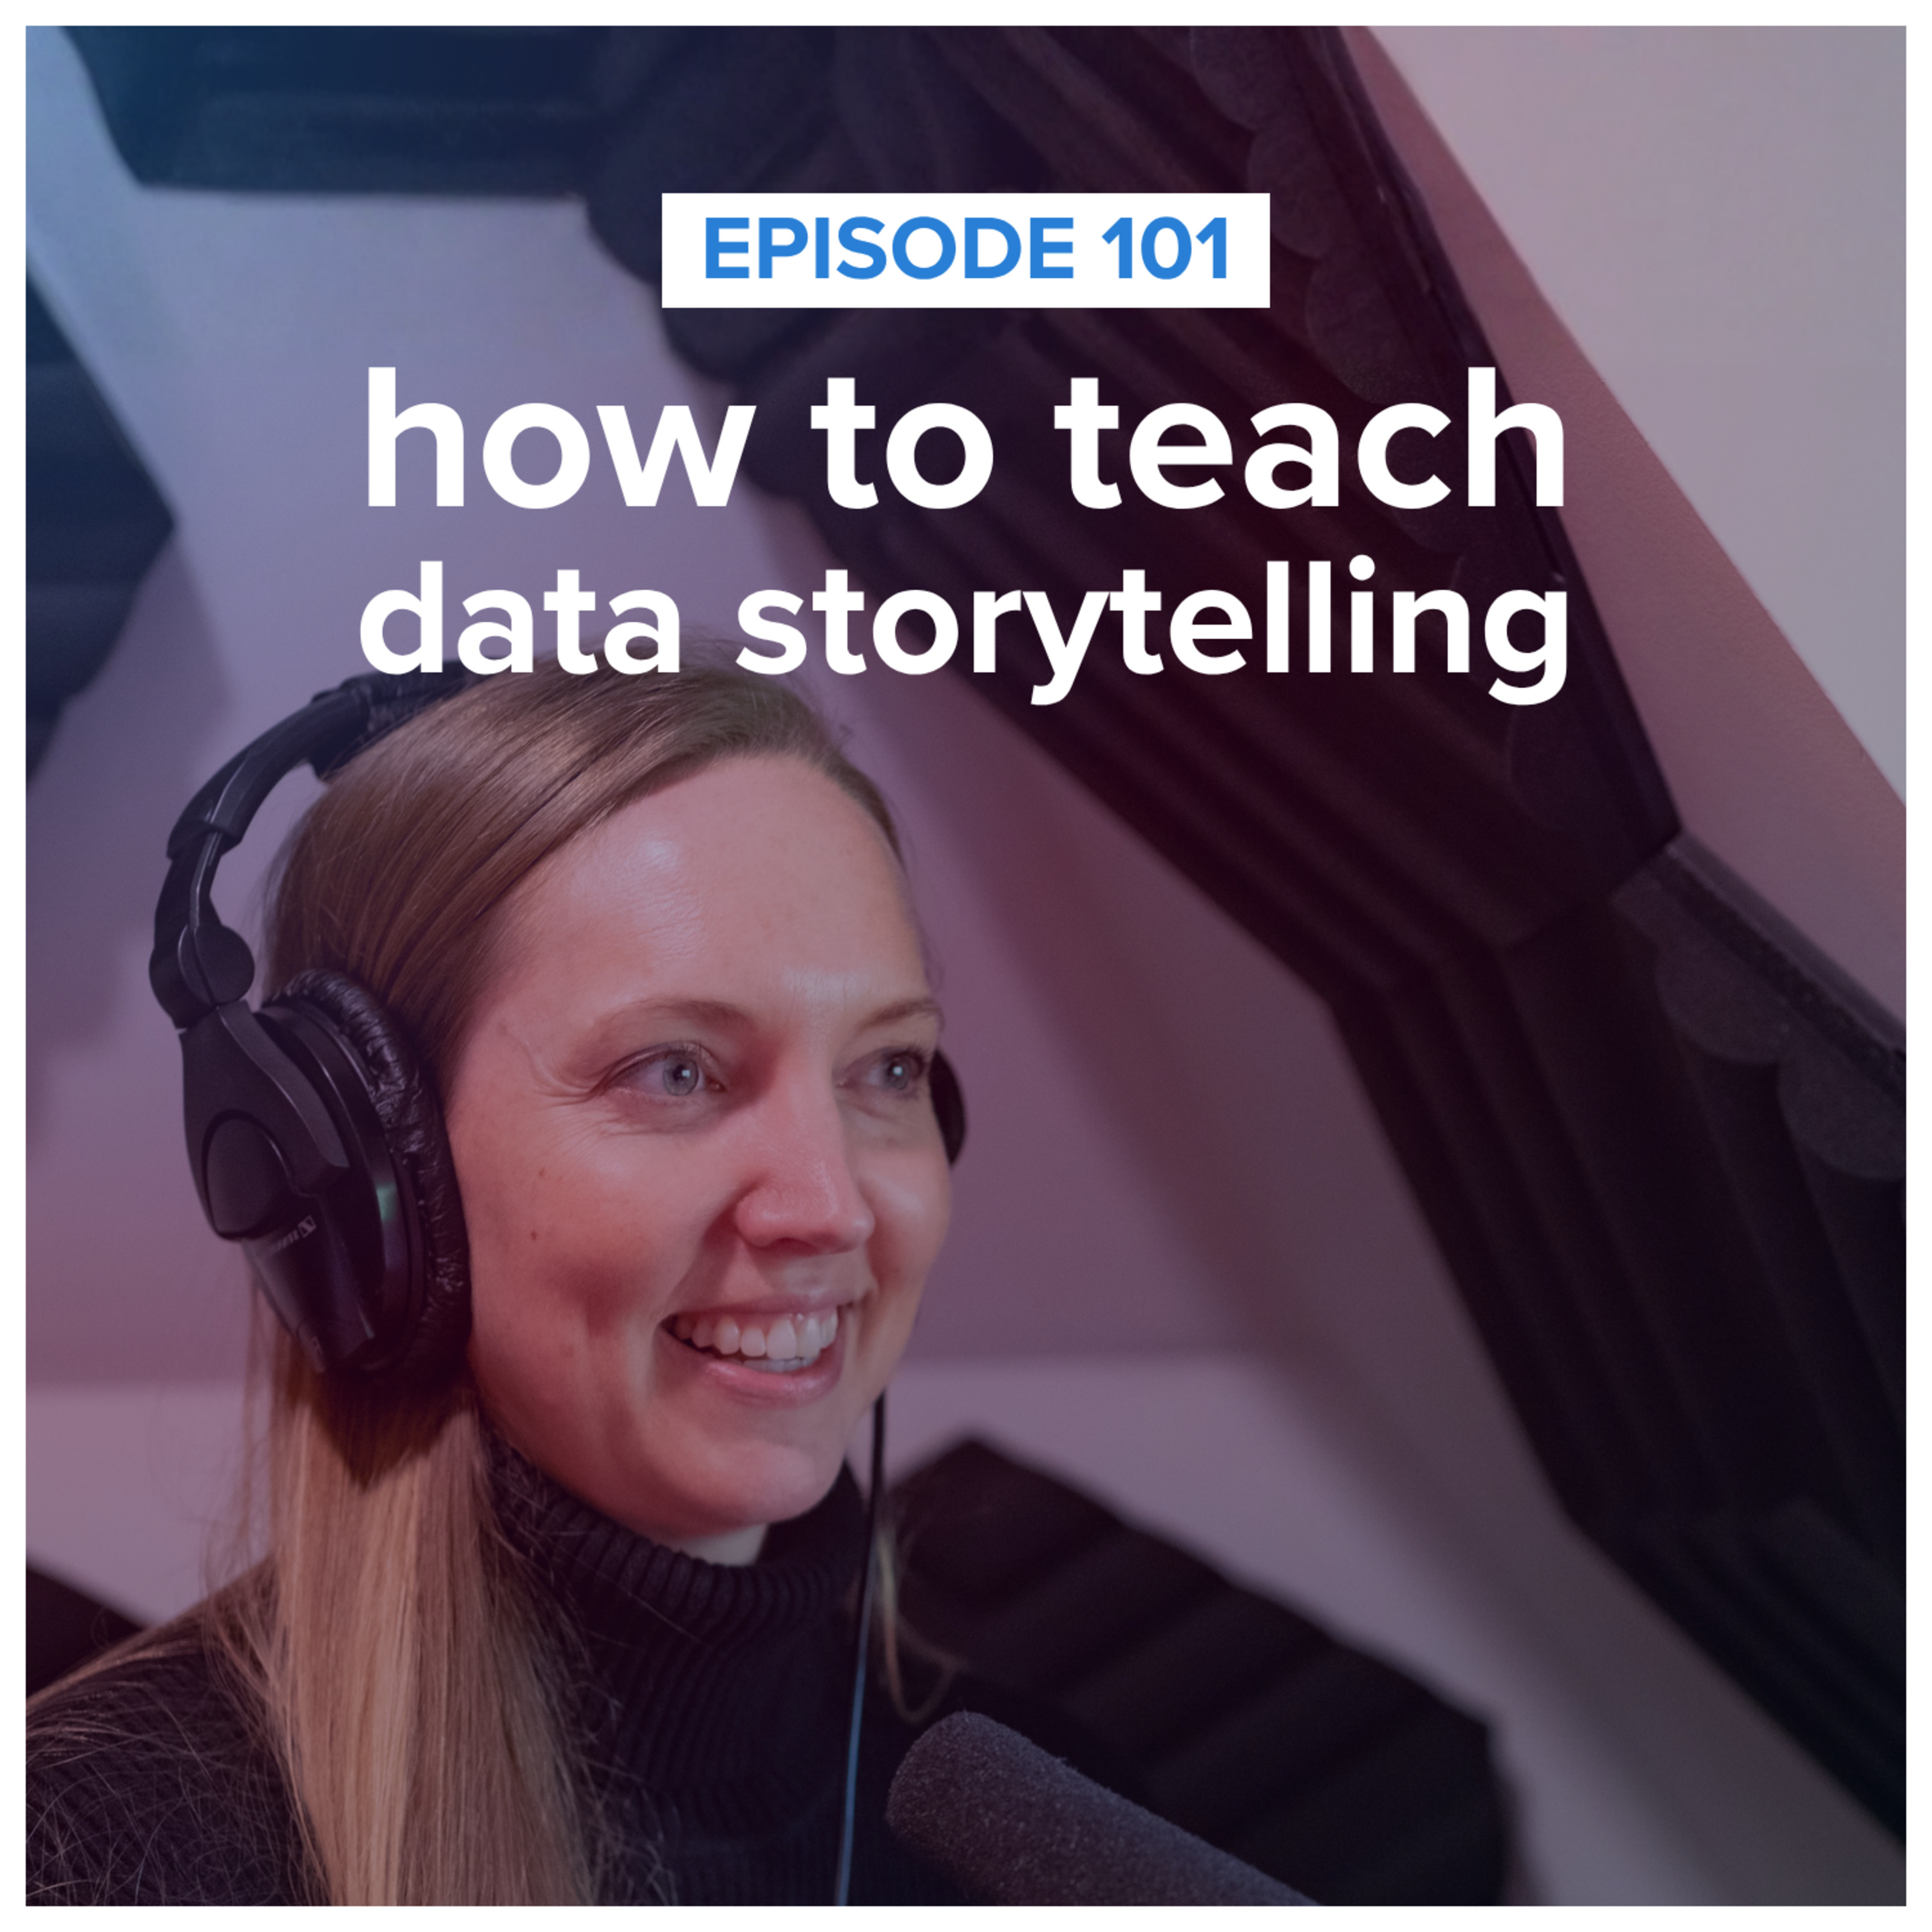 how to teach data storytelling | How do you teach data storytelling—and how does that change across disciplines, audiences, and experience levels?Join data storyteller Amy Esselman and members of the storytelling with data university instructor community as they discuss how they help students move beyond analyzing data to communicating it clearly. You'll hear practical teaching strategies, including hands-on critique, real-world datasets, audience-centered assignments, and thoughtful conversations about the role of AI in the classroom.Whether you're an educator, trainer, team leader, or aspiring practitioner, you'll come away with ideas for helping yourself and others turn analysis into understanding—and understanding into action.RELATED RESOURCESShow notesSWD instructor resource hubBig Idea worksheetFeatured guests:Francisco Cruzado PerniLisa CarlsonSimon CondliffElizabeth RicksJoel DunahoeRegister for our virtual live event on July 13th, 2026! AI for data storytelling: better graphs, slides, and presentations | — | ||||||
| 6/25/26 | 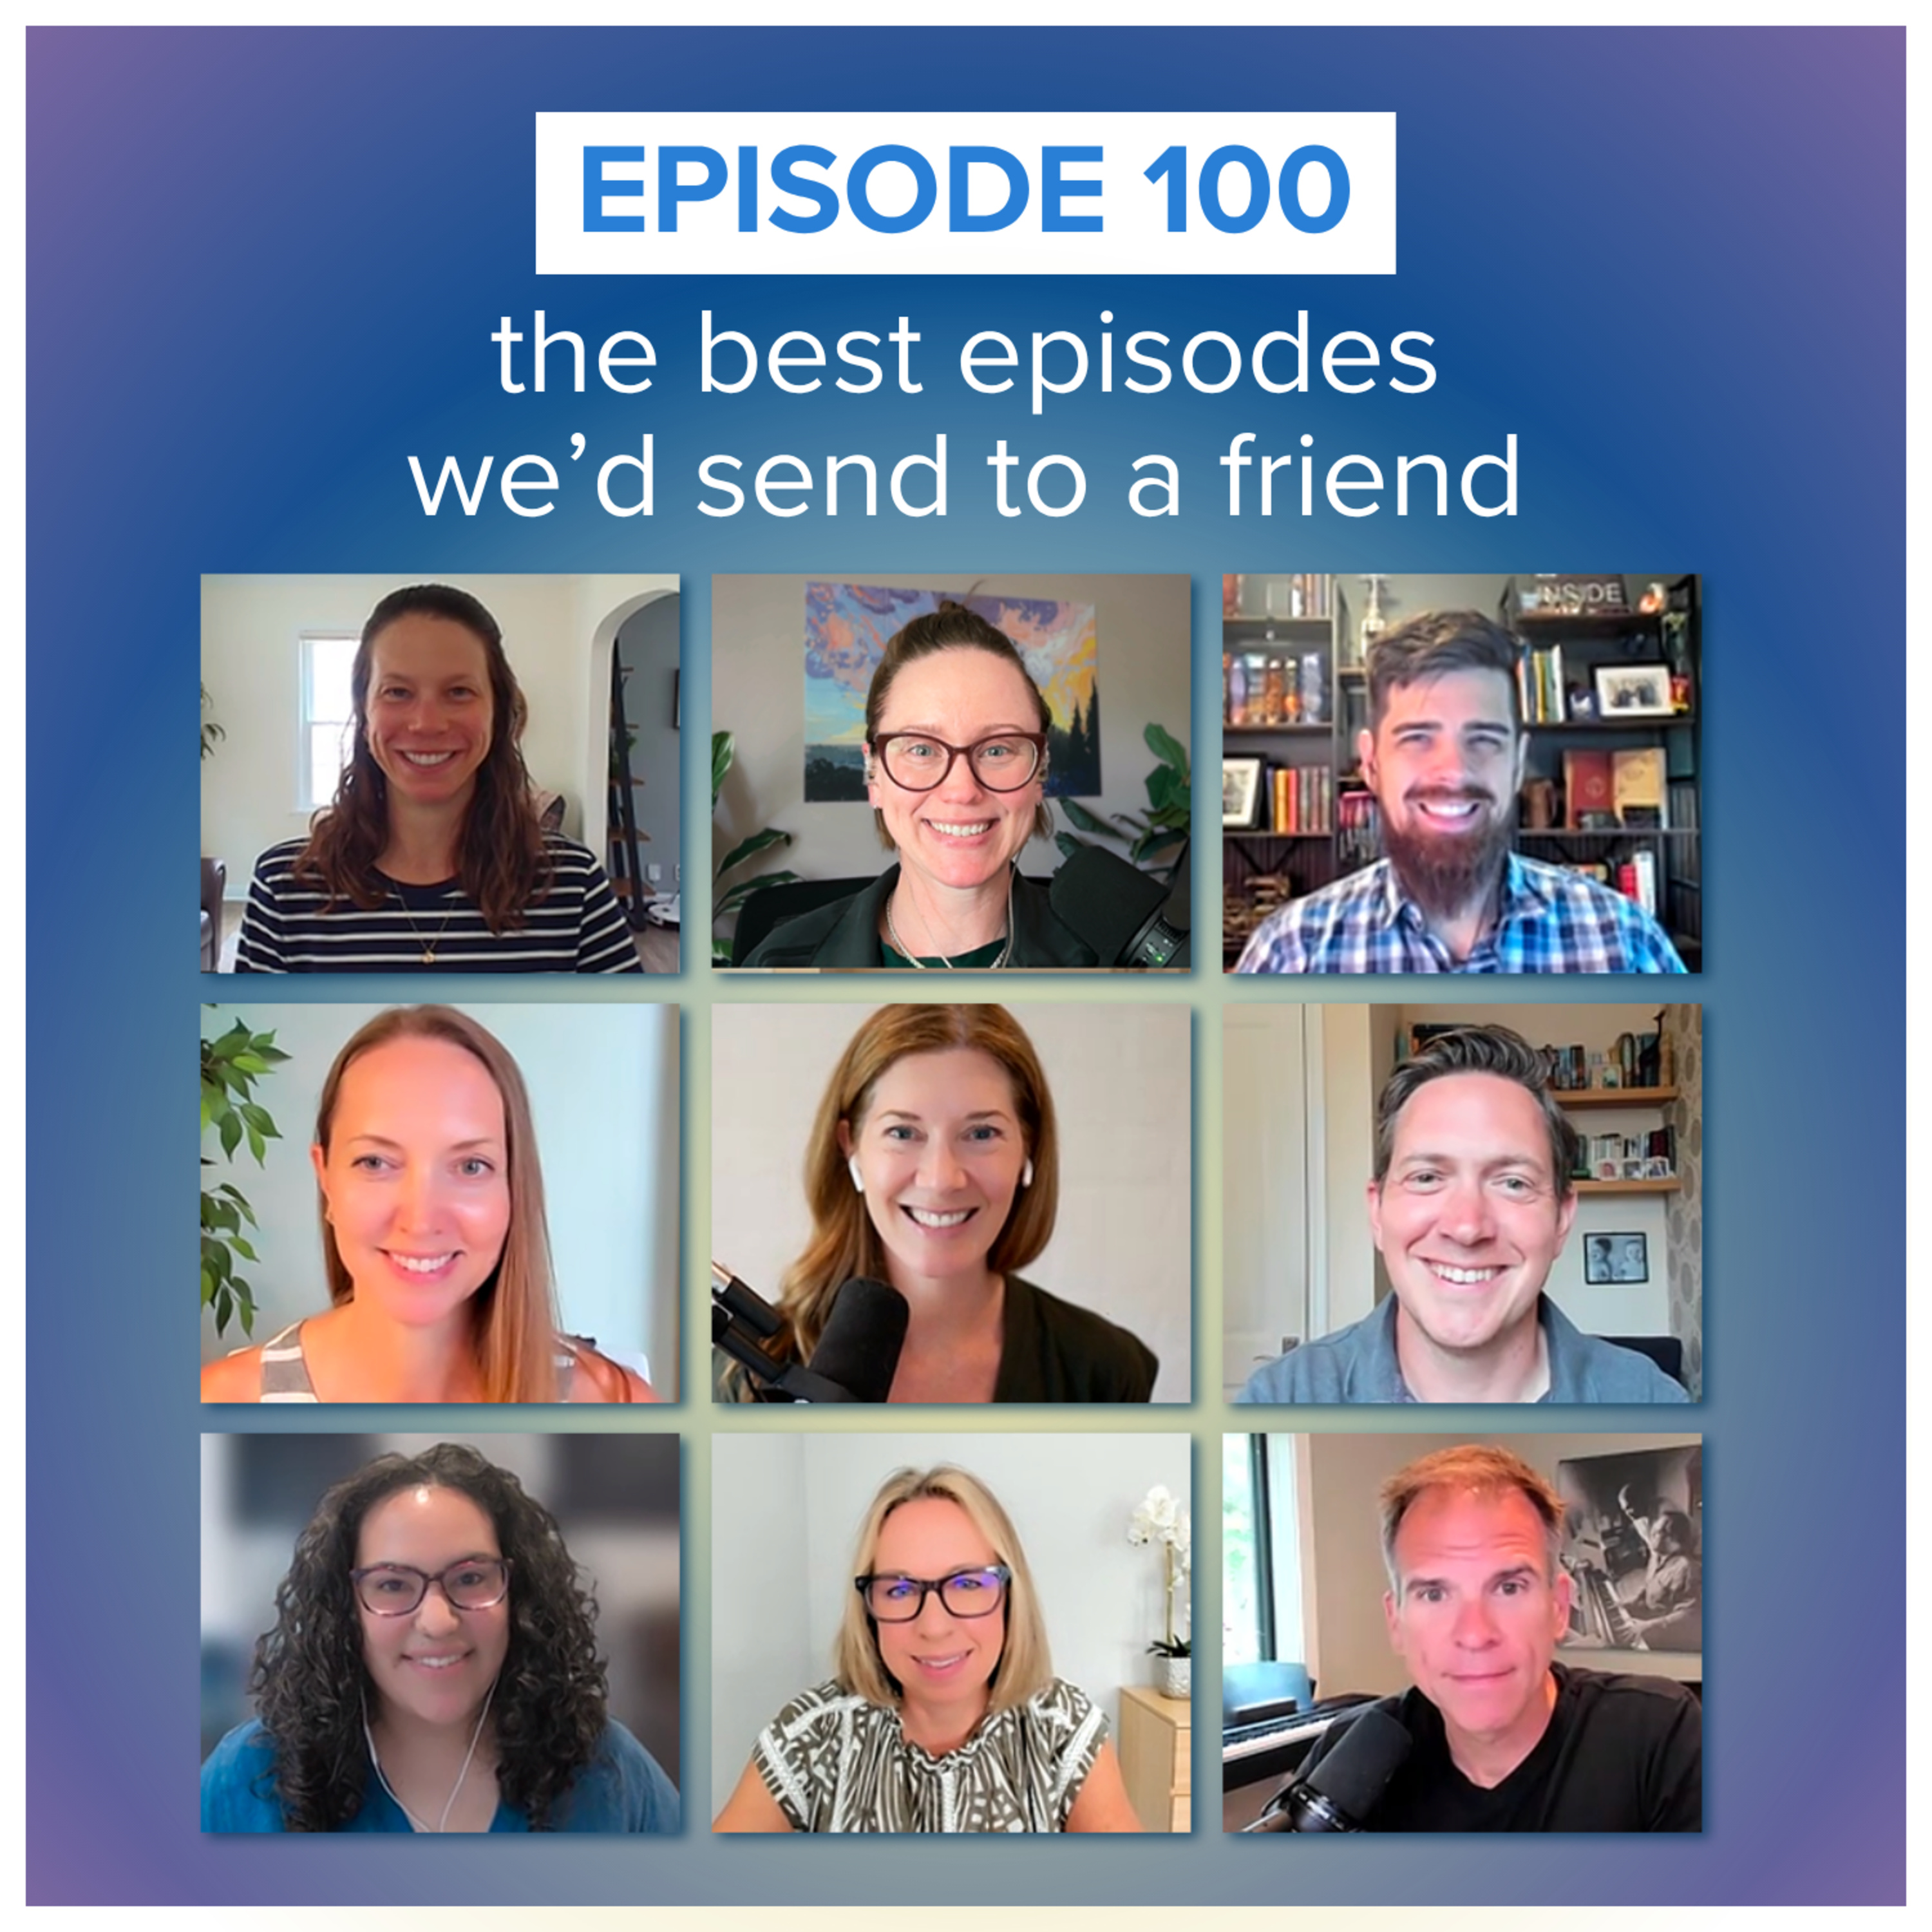 storytelling with data podcast: #100 the best episodes we’d send to a friend | In this special 100th episode, the storytelling with data team looks back at our favorite podcast moments and shares the episodes we'd recommend depending on where you are in your data storytelling journey.Whether you're learning the fundamentals, trying to create more compelling stories, thinking more strategically, influencing stakeholders, or presenting with confidence, we've curated special playlists to help you find the right episodes faster.Along the way, you'll hear memorable clips, practical lessons that have stuck with us over the years, and the moments that changed how we think about communicating with data.If you're new to the podcast, this episode is the perfect place to start. If you've been with us for all 100 episodes, you'll discover hidden gems worth revisiting.Show noteshttps://www.storytellingwithdata.com/podcast/100Spotify PlaylistsLearning data storytelling basics: PlaylistCreating better stories: PlaylistThinking strategically: PlaylistInfluencing people and decisions: PlaylistPresenting with confidence: Playlist | — | ||||||
| 6/2/26 |  storytelling with data podcast: #99 learn to love critique (even if you’re sensitive)✨ | feedbackcritique+4 | Alli | storytelling with datastorytelling with you | — | feedbackcritique+5 | — | 59m 20s | |
| 5/6/26 | 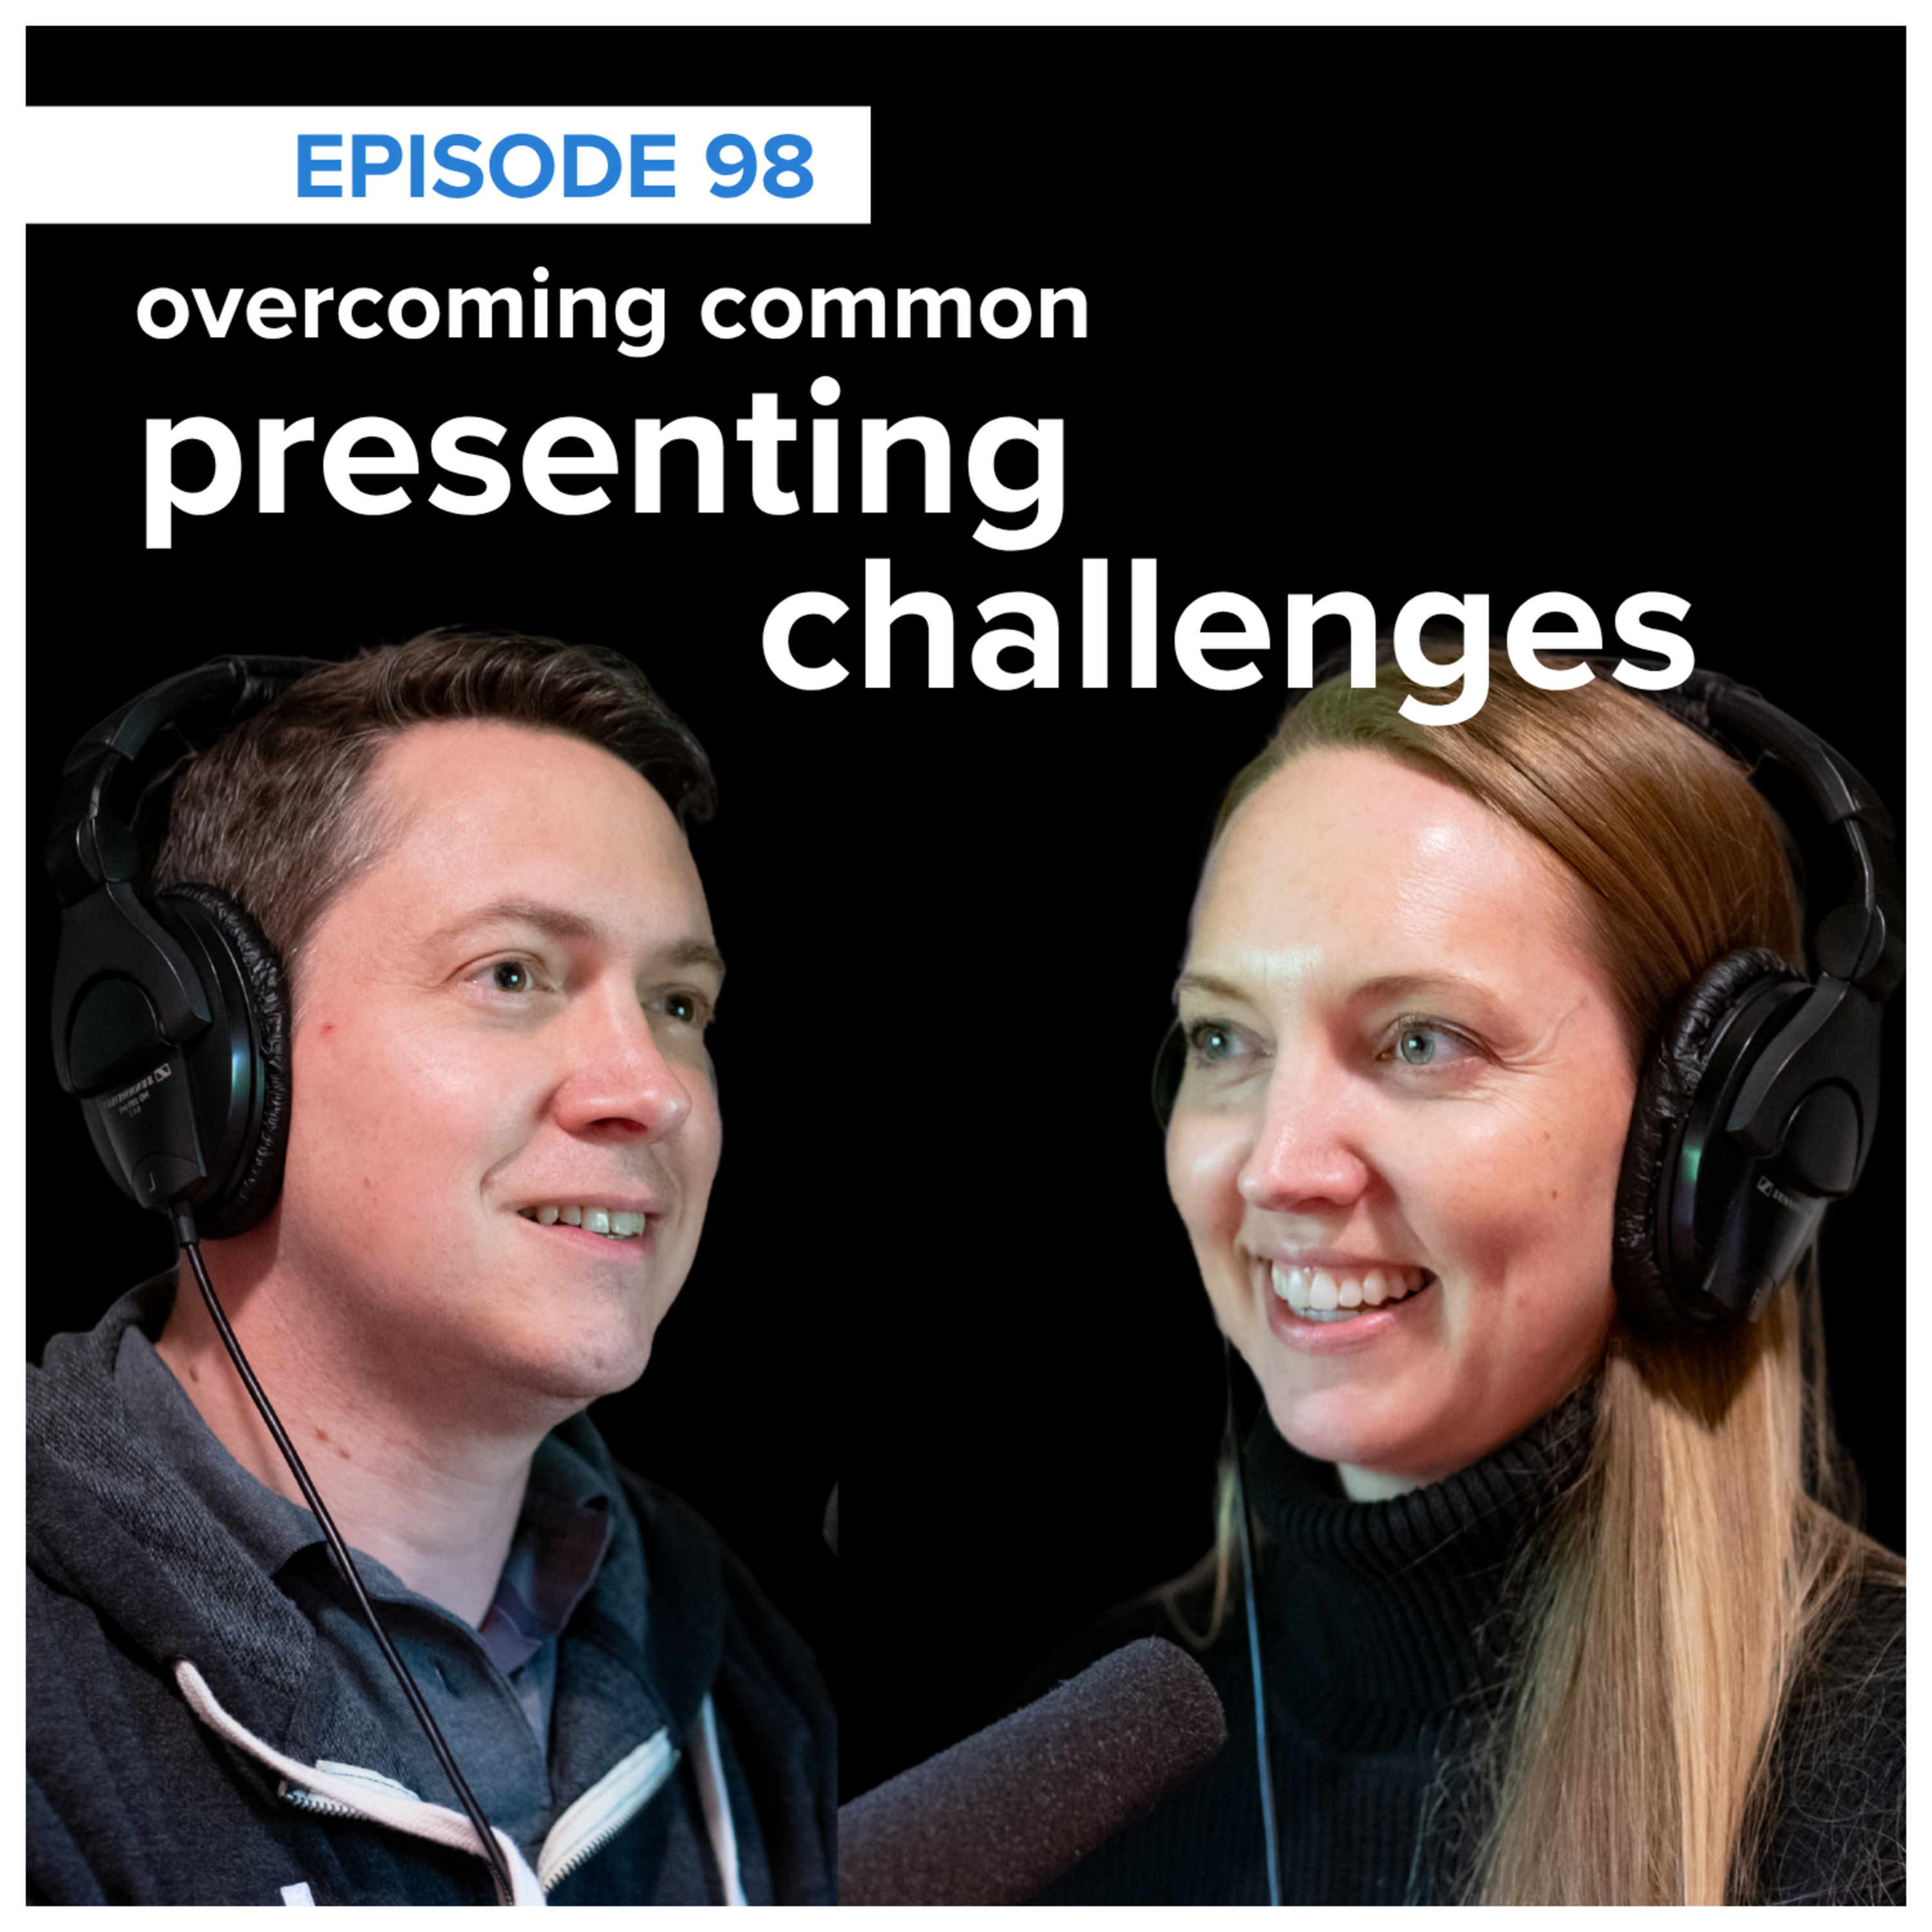 storytelling with data podcast: #98 how to overcome your presentation challenges✨ | presentation challengesstorytelling+4 | — | storytelling with youstorytelling with data+3 | — | presentationstorytelling+5 | — | 1h 07m 19s | |
| 5/6/26 |  storytelling with data podcast: #97 delivering business value with data, with Shachar Meir✨ | data professionalsbusiness outcomes+4 | Shachar Meir | YouTube Career unblocking mini-courseMeta+2 | — | data valuebusiness strategy+4 | — | 54m 42s | |
| 2/9/26 |  storytelling with data podcast: #95 Structure Liberates – Why Your Data Needs a Style Guide with Maxine Graze✨ | data visualizationstyle guides+3 | Maxine Graze | Kingstorytelling with data+2 | — | data visualsstyle guide+3 | — | 46m 18s | |
| 1/9/26 |  storytelling with data podcast: #96 what’s the story behind your data? demystifying data equity with Heather Krause✨ | data equityquantitative research+3 | Heather Krause | We All Count | — | data equityquantitative research+3 | — | 41m 56s | |
| 12/4/25 |  storytelling with data podcast: #94 the uncharted territory of data and music with Chris Dalla Riva✨ | — | Chris Dalla Riva | AudiomackSuno AI+11 | — | data analysismusic industry+5 | — | 41m 20s | |
| 11/16/25 |  storytelling with data podcast: #93 revisiting the magic of story✨ | storytellingdata visualization+4 | — | storytelling with data: a data visualization guide for business professionalsLessons in Storytelling+1 | — | storytellingdata visualization+5 | — | 39m 53s | |
Want analysis for the episodes below?Free for Pro Submit a request, we'll have your selected episodes analyzed within an hour. Free, at no cost to you, for Pro users. | |||||||||
| 10/3/25 |  storytelling with data podcast: #92 Why Dashboards Die—and How to Save Them With Allison Horst✨ | dashboardsdata visualization+4 | Allison Horst | Observablestorytelling with data+1 | — | dashboardsdata products+5 | — | 49m 35s | |
| 9/19/25 |  storytelling with data podcast: #91 Dashboards that Deliver with Andy Cotgreave✨ | data visualizationdashboards+5 | Andy Cotgreave | Tableaustorytelling with data+3 | — | dashboardsdata visualization+5 | — | 52m 02s | |
| 8/19/25 | storytelling with data #90: ask smart questions (rebroadcast)✨ | data analysisquestioning techniques+3 | — | Before and Afterstorytelling with data | NYC | smart questionsdata analysis+3 | — | 40m 58s | |
| 6/30/25 |  storytelling with data podcast: #89 putting the art in chart with Nadieh Bremer✨ | data visualizationdata storytelling+3 | Nadieh Bremer | Chart: Designing Creative Data Visualizations from Charts to ArtPatchwork Kingdoms+3 | — | data visualizationdata storytelling+5 | — | 47m 00s | |
| 5/15/25 |  storytelling with data podcast: #88: swimmer, startup, storyteller with fares ksebati✨ | swimmingstartup+4 | Fares Ksebati | MySwimProSwim Like a Pro+1 | Antalya, Turkey | swimmingMySwimPro+7 | — | 50m 22s | |
| 4/10/25 | storytelling with data podcast: #87: the founder’s journey: From Lagos to Zurich to AI-Powered Insights | In this second installment of our new podcast series, The Founder’s Journey, we sit down with Odun Odubanjo, CEO and founder of Insight7, a platform making qualitative data instantly actionable.Odun’s story starts in Lagos, Nigeria, where a chance internship at Google Zurich opened a door that would eventually lead to founding multiple startups, scaling a business across Africa, working at Shopify in Canada, and launching Insight7 in the U.S. Today, Odun helps organizations turn qualitative data—from customer calls to interviews—into meaningful business insights.In this episode, Randy and Odun talk about:The surprising power of staying in touchLessons learned building startups in Africa and breaking into new marketsHow Insight7 helps teams unlock the hidden value in their qualitative dataThe power of storytelling as a founder, including a “holy moly” moment with a new customerNavigating the AI revolution and how tools like ChatGPT and Claude are reshaping the way we build, communicate, and leadOdun also shares his perspective on why now is the best time to be alive—and to start something new. Tune in and be inspired by the story of a founder who’s innovating across continents and categories.Learn more about Insight7 at insight7.ioConnect with Odun on LinkedIn: linkedin.com/in/odunodu | — | ||||||
| 3/13/25 | storytelling with data podcast: #86: speak so others listen | Want to speak in a way that makes others want to listen? In this episode, Cole dives into the art of confident communication—how to eliminate filler words, command attention with your voice and body language, and project confidence even when you don’t feel it. She shares real-world strategies from working with high schoolers, future business leaders, and university students, plus personal lessons learned in her career. Whether you’re preparing for a big presentation, an important meeting, or simply want to improve how you communicate every day, this episode is packed with actionable takeaways to help you speak with clarity and impact.Related links:Children’s book: Daphne Draws DataTeach kids: Daphne’s Data Detectives ProgramWorksheet: the story of youBook: storytelling with you: plan, create, & deliver a stellar presentationLondon event (Apr 27): Daphne Draws DataLondon event (Apr 28): storytelling and presenting with data masterclassPreorder! storytelling with data: before & afterPlush Daphne on Amazon and in storytellingwithdata.com/shop (enter PODCAST10 for 10% off)Many more resources at storytellingwithdata.com | — | ||||||
| 2/20/25 | storytelling with data podcast: #85 what founders can teach us about storytelling & resilience | NEW SERIES: The Founder’s Journey – Stories of Building, Scaling & StorytellingWe’re launching something new on thestorytelling with data podcast! In this special series, we’ll sit down with founders who are building something remarkable—diving into their journeys, the lessons they’ve learned, and the storytelling strategies that fuel their success.In this episode, Randy is joined by Doni Priliandi, founder of HappyFive, an employee engagement and performance management platform. Doni’s path is one of persistence, risk-taking, and strategic storytelling. From cold-emailing Google’s Laszlo Bock to hopping on a last-minute flight from Jakarta to Silicon Valley, Doni’s story is filled with bold moves and valuable insights. He shares how being an underdog can be a superpower, why storytelling is crucial for founders, and the lessons he’s learned while expanding into the U.S. market.Whether you're an entrepreneur, a leader, or simply someone looking for inspiration, this episode offers a fascinating look at the intersection of data, storytelling, and startup success.Related Links:Check out Happy5's performance management software platformLink up with Doni on LNKDRead Work Rules by Laszlo Bock | — | ||||||
| 2/6/25 | storytelling with data podcast: #84 mastering time | Time is a finite resource, so how do you make the most of it? Cole is joined by her husband, Randy, for a conversation on the art of getting things done, both in business and in life. From balancing busy work schedules to managing a family of five, they share their strategies for prioritization, productivity, and focus. They break down their individual approaches—covering automation, delegation, scheduling, and the power of saying no—to create more space for what truly matters. Packed with practical insights, this episode will help you reclaim time and boost your productivity.Related links: Follow Randy: LinkedIn | Twitter Daphne Draws Data Episode 13 goals like Google London masterclass | — | ||||||
| 1/24/25 | storytelling with data podcast: #83 reflect and refine | What if a simple pause could transform the way you work? In this episode, Cole delves into the concept of statio—a meditative pause during transitions—and its potential to inspire more thoughtful, impactful decisions in data analysis and communication. From asking the right questions at the start of a project to fine-tuning your slides before a presentation, discover how small, intentional moments of reflection can ignite creativity, sharpen focus, and elevate your work. Ready to pause, breathe, and see things differently? Listening time 21:15 | related links: On-demand online course: behind the slides Big Idea worksheet Feb 6th virtual workshop (use code PODCAST10 for 10% off) 2025 workshop schedule Daphne Draws Data in Spanish DaphneDrawsData.com SWD shop | — | ||||||
| 12/9/24 | storytelling with data podcast: #82 everyday design & dataviz | What do doors, wrapping paper, and speed bumps have in common? In this episode, Cole uncovers how the design of everyday objects can inspire better graphs and slides. Through relatable stories and practical takeaways, discover how thoughtful design can transform confusion into clarity and create moments of delight for your audience. related links: SWD holiday shop (use code PODCAST10 for 10% off in the shop & on workshops/courses) SWD online community 8-week online course SWD chart guide Book: The Design of Everyday Things Book: Universal Principles of Design Book: 100 Things Every Designer Needs to Know about People Dec 16th public workshop 2025 public workshop schedule SWD YouTube channel | — | ||||||
| 11/7/24 |  storytelling with data podcast: #81 How to Make Math Magical for Kids: Cole & Jon Orr from Make Math Moments | In this episode, Cole teams up with Jon Orr, co-founder of Make Math Moments, for an inspiring discussion on how to transform math education for young learners. They dive into Cole's new book, Daphne Draws Data, and explore how storytelling and visual data can empower children to approach math with curiosity and confidence. Cole and Jon share personal stories and professional insights on why sparking interest in math early is crucial. They also provide practical advice on integrating data visualization into classroom activities to make math both meaningful and engaging for kids. Whether you're an educator, parent, or data enthusiast, this episode offers a fresh perspective on teaching math in a way that sticks. Listening time 24:41 | related links: Related Links: Daphne Draws Data Official Site Register for the Make Math Moments Virtual Conference (Nov. 15-17) Make Math Moments That Matter Podcast Join our Daphne Draws Data Educator Community | — | ||||||
| 9/4/24 |  storytelling with data podcast: #80 Inspiring The Next Generation - Daphne Draws Data | In this special episode, Cole unveils her new children's book, "Daphne Draws Data," a vibrant adventure aimed at making data, numbers and graphs accessible to young minds. Inspired by her own children's curiosity, Cole discusses the importance of introducing data literacy early through storytelling, illustrated by the talented John Skewes. Join Cole as she shares insights into creating the book, its enchanting characters, and how Daphne the dragon helps her friends solve problems using data. Discover how you can help ignite a passion for data in the next generation and hear a sample of the audio book! Related Links: Daphne Draws Data Official Site Order on Amazon Listen to the Audiobook Daphne Draws Data Resources for Parents Sign up for the Daphne Mailing List Follow Daphne on Instagram, YouTube, and Pinterest | — | ||||||
| 8/14/24 |  storytelling with data podcast: #79 Recast: Cole & EXP Milwaukee | Cole sits down with Steve Glynn in an episode recorded for the Experience Milwaukee podcast that we’ve recast here. Tune in to hear about Cole’s path, books, and…scotch?! The pair dive into Cole’s new children’s book, Daphne Draws Data: A storytelling with data adventure, talk about life in Wisconsin, and more. Listening time 23:45 | related links: Order Cole’s new book! Experience Milwaukee podcast Book: storytelling with data: a data visualization guide for business professionals Book: storytelling with data: let’s practice! Book: storytelling with you: plan, create, and deliver a stellar presentation Upcoming events: DaphneDrawsData.com/events Upcoming masterclass & more: storytellingwithdata.com/workshops | — | ||||||
| 6/10/24 |  storytelling with data podcast: #78 Visualize This with Nathan Yau | Join Cole as she chats with Nathan Yau, founder of FlowingData and author of Visualize This and Data Points. Nathan shares his journey from grad school at UCLA to becoming a renowned figure in data visualization. They discuss the evolution of his work, the inception of FlowingData, and the impact of his books on the field. Dive deep into the creative process behind visualizing data, the importance of asking questions, and the iterative nature of both data analysis and visualization. Listening time 51:25 | related links: Follow Nathan: flowingdata.com | LinkedIn | Twitter Buy Nathan’s new book! Visualize This, 2nd edition Book: Exploratory Data Analysis (Tukey) Interactive visual: How Americans Spend Their Day Blog post: How You Will Die Blog post: Ebb and Flow of Box Office Receipts (steam graph) Online to do list: Remember The Milk | — | ||||||
Showing 25 of 100
Pitch Fit is a Pro feature
See how bookable this show is for guests, which brands already advertise, the per-episode ad value, and the best-fit guest and sponsor profile. The numbers are blurred on the free plan.
How readily this show books outside guests like you.
How proven this show is for host-read sponsorships.
For Guests
ProFor Advertisers
ProUpgrade to Pro to unlock guest cadence, sponsor categories, fit scores, and per-episode ad value for this show.