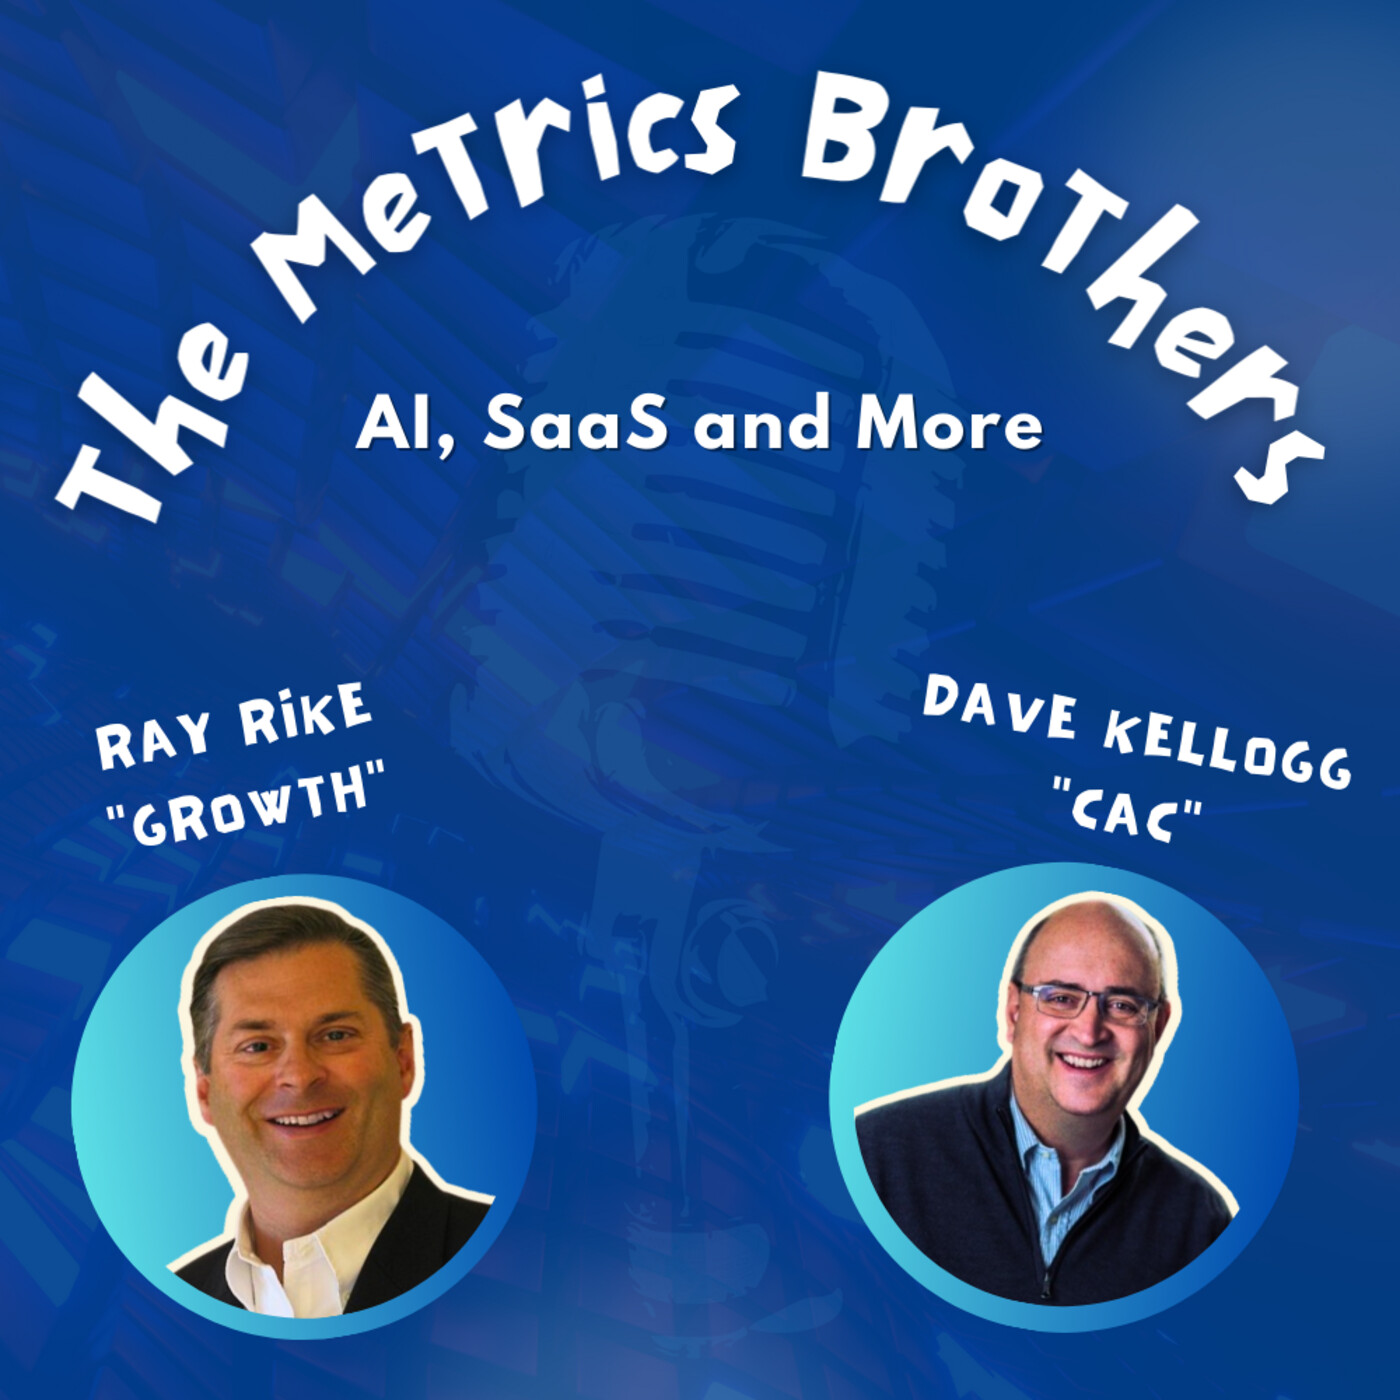
Insights from recent episode analysis
Audience Interest
Podcast Focus
Publishing Consistency
Platform Reach
Insights are generated by CastFox AI using publicly available data, episode content, and proprietary models.
Most discussed topics
Brands & references
Total monthly reach
Estimated from 11 chart positions in 11 markets.
By chart position
- 🇺🇸US · Management#6130K to 100K
- 🇬🇧GB · Management#1695K to 30K
- 🇫🇷FR · Management#5030K to 100K
- 🇰🇷KR · Management#1631K to 10K
- 🇮🇩ID · Management#853K to 10K
- Per-Episode Audience
Est. listeners per new episode within ~30 days
36K to 134K🎙 ~2x weekly·117 episodes·Last published 3w ago - Monthly Reach
Unique listeners across all episodes (30 days)
72K to 268K🇺🇸37%🇫🇷37%🇬🇧11%+8 more - Active Followers
Loyal subscribers who consistently listen
29K to 107K
Market Insights
Platform Distribution
Reach across major podcast platforms, updated hourly
Total Followers
—
Total Plays
—
Total Reviews
—
* Data sourced directly from platform APIs and aggregated hourly across all major podcast directories.
On the show
From 15 epsHosts
Recent guests
No guests detected in recent episodes.
Recent episodes
The Metrics Brothers Hiatus
Jun 3, 2026
12m 14s
The Agentic Work Unit (AWU)
May 27, 2026
27m 42s
Private Credit and the Medallia Incident
May 13, 2026
29m 09s
The Redpoint 2026 State of the Market Report
May 7, 2026
29m 23s
The Intercom AI Transformation
Apr 29, 2026
23m 40s
Social Links & Contact
Official channels & resources
Official Website
Login
RSS Feed
Login
| Date | Episode | Topics | Guests | Brands | Places | Keywords | Sponsor | Length | |
|---|---|---|---|---|---|---|---|---|---|
| 6/3/26 | The Metrics Brothers Hiatus✨ | podcast hiatusSaaS metrics+3 | — | IntercomScale Ventures+2 | — | podcasthiatus+7 | — | 12m 14s | |
| 5/27/26 | The Agentic Work Unit (AWU)✨ | AI agent activityoutcome-based pricing+4 | — | Salesforce | — | Agentic Work UnitAWU+7 | — | 27m 42s | |
| 5/13/26 | Private Credit and the Medallia Incident✨ | Private CreditSaaS finance+4 | — | SOFRMedallia+1 | — | private creditSaaS+6 | — | 29m 09s | |
| 5/7/26 | The Redpoint 2026 State of the Market Report✨ | AI market updateB2B SaaS+4 | — | Redpoint VenturesQatalyst+4 | — | AIB2B SaaS+5 | — | 29m 23s | |
| 4/29/26 | The Intercom AI Transformation✨ | AI transformationB2B SaaS+4 | — | Intercom | — | IntercomAI transformation+7 | — | 23m 40s | |
| 4/22/26 | The State of B2B Go-to-Market in 2026: The ICONIQ Findings✨ | B2B Go-to-MarketICONIQ Report+4 | — | ICONIQB2B SaaS+3 | — | B2BGo-to-Market+6 | — | 27m 12s | |
| 4/14/26 | Revenue per Employee✨ | productivity metricsrevenue per employee+4 | — | CursorBenchmarkit+2 | — | revenue per employeeproductivity metrics+5 | — | 25m 56s | |
| 4/1/26 | Segments vs. Cohorts: What’s the Difference?✨ | metrics analysissegments+4 | — | Norwest | — | segmentscohorts+5 | — | 28m 05s | |
| 3/25/26 | Norwest B2B Sales & Marketing Benchmark Report✨ | B2B SalesMarketing Benchmark+5 | — | Norwest | — | B2B SalesMarketing+6 | — | 32m 15s | |
| 3/11/26 | The Rule of 40 Becomes the Rule of 60✨ | SaaS performanceRule of 40+4 | — | SaaSprivate equity+1 | — | Rule of 40Rule of 60+7 | — | 25m 43s | |
Want analysis for the episodes below?Free for Pro Submit a request, we'll have your selected episodes analyzed within an hour. Free, at no cost to you, for Pro users. | |||||||||
| 3/5/26 | A Tale of Two AI Futures - Citrini vs Citadel✨ | AI futureseconomic collapse+4 | — | CitriniCitadel+2 | — | AIeconomic crisis+7 | — | 27m 36s | |
| 3/2/26 | ICONIQ State of AI: Bi-Annual Snapshot Report✨ | AI product developmentmarket transition+3 | — | ICONIQAI | — | AI productsgross margins+3 | — | 30m 20s | |
| 2/18/26 | The SaaSpocalypse and the Avenir Future of SaaS Report✨ | SaaS market analysisAI in SaaS+3 | — | AvinerServiceNow+1 | — | SaaSpocalypseAI Fear of Being Obsolete+3 | — | 49m 19s | |
| 2/11/26 | The Impact of AI on Labor Productivity and Growth✨ | AI impact on productivitylabor productivity+4 | — | Bureau of Labor StatisticsSaaS+1 | U.S.Ireland+1 | labor productivityAI+6 | — | 25m 10s | |
| 2/5/26 | Brand Measurement Metrics and Techniques✨ | brand measurementmarketing+4 | — | The Metrics Brothers | — | brand measurementmarketing metrics+5 | — | 26m 55s | |
| 1/28/26 | The State of Generative AI in the Enterprise 2025 | The State of Generative AI in the Enterprise 2025In this episode of The Metrics Brothers, Ray Rike and Dave Kellogg break down the 2025 State of Generative AI in the Enterprise report from Menlo Ventures and explain what the data really says about where enterprise AI adoption is accelerating and where the market is consolidating.The headline takeaway: AI software is scaling faster than any software category in history. Enterprise AI spend has exploded from roughly $1.7B in 2023 to nearly $37B in 2025, reaching scale in just three years. This revenue milestone took SaaS more than 15 years to achieve. Foundational models now represent the single largest area of spend, highlighting how infrastructure and model access remain core to enterprise AI strategies.Ray and Dave also explore a major strategic shift inside the enterprise: buy is decisively beating build. In 2025, 76% of enterprise AI solutions are purchased rather than built internally, up sharply from 53% the year prior. Rapid model evolution, ongoing retraining costs, and model drift are making internal AI development far more expensive to maintain than many teams originally expected.One of the most surprising findings is on go-to-market efficiency. AI software pilots convert to production at nearly twice the rate of traditional software, with roughly 47% of AI pilots reaching production versus about 25% for conventional enterprise software. This runs counter to recent narratives suggesting enterprise AI pilots are stalling and points to clearer ROI and faster time-to-value.The episode also dives into what Menlo calls the first true “AI killer app”: AI-assisted coding. Coding tools now account for more than half of departmental AI spend, with over 50% of developers already using AI coding assistants and adoption exceeding 65% among top-quartile teams. Real-world examples show meaningful productivity gains, including double-digit increases in development velocity and significant time savings during legacy system upgrades.Industry-wise, healthcare emerges as the largest buyer of vertical AI, representing 43% of vertical AI spend. This is notable given healthcare’s historically lower IT spend as a percentage of revenue. Much of the value is coming from administrative automation such as medical scribing, where AI directly reduces non-clinical workload and unlocks meaningful productivity gains for care providers.Finally, Ray and Dave examine the shifting competitive landscape among foundation model providers. Anthropic has surged to roughly 40% share of enterprise AI usage, up dramatically from prior years, while OpenAI’s share has declined as Google continues to gain traction. The discussion centers on focus versus breadth and why enterprise positioning and reliability may matter more than consumer mindshare.Key takeaways from the episode:AI software is the fastest-scaling software category everEnterprises are rapidly moving from build to buyAI pilots convert to production at nearly 2x traditional softwareAI coding is emerging as the first true enterprise AI killer appAnthropic’s enterprise focus is translating into meaningful market share gainsIf you care about how AI adoption actually translates into spend, productivity, and competitive advantage inside large organizations, this episode is a must-listen.See Privacy Policy at https://art19.com/privacy and California Privacy Notice at https://art19.com/privacy#do-not-sell-my-info. | — | ||||||
| 1/21/26 | Dissecting the MIT NANDA Report | The claim that “95% of AI projects fail” has become one of the most repeated talking points in enterprise AI. But where did it come from, and does it actually hold up?In this episode, Dave "CAC" Kellogg and Ray "Growth" Rike take a detailed, data-driven look at the MIT NANDA report, titled The GenAI Divide: State of AI in Business 2025. They break down how the "95% fail rate" statistic went viral, why it stuck, and why the underlying evidence does not support such a sweeping conclusion.What Ray and Dave cover:Why the NANDA report is often mistaken for a peer-reviewed academic study when it is notHow ambiguous definitions of “failure” turn partial adoption into sensational headlinesData inconsistencies and methodological gaps that undermine the 95% claimThe difference between failed AI initiatives and early-stage pilots or experimentsWhy measuring AI success by the percent of projects is misleading compared to the business value createdThe rise of Shadow AI and employee-driven adoption, and why that may be a feature, not a flawHow the report’s conclusions conveniently align with the authors’ proposed NANDA architectureThe real issues enterprises face with AI: workflow integration, governance, and change managementThe episode also discusses why personal productivity gains still matter to the P&L, even if they do not appear as a clear line item, and why fear-driven AI narratives can do real damage within organizations.Key takeaway: The NANDA report raises some legitimate concerns about scaling AI from pilot to production, but the infamous “95% of AI projects fail” claim does not survive close inspection. Leaders should read the report skeptically and push back when flawed statistics begin to drive decisions and strategy.Recommended for: CFOs, operators, AI leaders, and anyone tired of scary AI statistics that fall apart under scrutiny.See Privacy Policy at https://art19.com/privacy and California Privacy Notice at https://art19.com/privacy#do-not-sell-my-info. | — | ||||||
| 1/14/26 | 2026 Brand vs Demand Benchmark Report | Brand vs Demand: Why B2B Marketing Is Stuck in a Measurement TrapIn this episode of The Metrics Brothers, Dave "CAC" Kellogg and Ray "Growth" Rike tackle one of the most persistent and controversial questions in B2B marketing: Brand vs. Demand.The discussion is grounded in new data from the 2026 B2B Brand vs Demand Benchmark Report. While most marketing teams say they believe brand and demand are complementary, the numbers tell a more complicated story.Today’s reality?Marketing budgets are still heavily skewed toward short-term demand generation, with roughly 70% of spend allocated to demand and only ~25% to brand. Yet when asked how they want to invest, marketing leaders overwhelmingly say they’d prefer a much more balanced future, closer to 50% demand and 40% brand.So why the disconnect?Ray and Dave dig into the root cause: measurement.Demand generation is tied to metrics CFOs understand like pipeline dollars, opportunities, and ARR. Brand, on the other hand, is still largely measured using proxy metrics like website traffic and awareness, leaving many executives unable to confidently link brand investments to revenue outcomes. Only 28% of companies say they can directly tie brand activity to pipeline, and when budgets are cut, brand is sacrificed five times more often than demand.The episode also explores:Why performance marketing struggles are pushing CMOs back toward brandThe growing inefficiency of demand spend aimed at “future buyers”How much of the “demand” budget is effectively unmeasured brand spendThe dangerous gap between belief in brand and proof of impactWhy AEO, AI search, and LLM visibility will make brand ROI even harder and more urgent to measureRay and Dave don’t just highlight the findings, they discuss the reality of Chief Marketing Officers making the Brand vs Demand budget allocation trade-offs.One key takeaway? Until brand investments can be credibly connected to pipeline efficiency, win rates, and ARR, it will remain more a faith-based investment instead of a financial one the CFOs understand.If you’re a CMO trying to defend brand spend, or a CFO trying to understand where marketing dollars truly drive growth, this episode is required listening.See Privacy Policy at https://art19.com/privacy and California Privacy Notice at https://art19.com/privacy#do-not-sell-my-info. | — | ||||||
| 1/7/26 | Tidemark 2025 Vertical SaaS Report | In this episode of The Metrics Brothers, Dave "CAC" Kellogg and Ray "Growth" Rike break down the 2025 Tidemark Vertical & SMB SaaS Benchmark Report. Drawing from data across 200+ companies, the report explores control points, multi-product expansion, fintech monetization, and AI adoption, but not all conclusions hold up under scrutiny as they are sometimes take on the tone of a narrative summary rather than insights purely from data-backed research.Ray and Dave dig into what the data actually supports versus where narrative may be running ahead of evidence. They unpack the concept of “control points,” examine why fintech (especially payments) continues to dominate expansion strategies, and challenge whether multi-product really delivers the retention and growth advantages many assume. Along the way, they highlight where benchmarks are useful, where definitions blur, and why context matters more than ever.The episode also explores the rapid rise of AI inside Vertical SaaS, from attach rates to monetization models and asks the hard question: "Does AI actually drive better performance, or is it simply becoming table stakes?" If you’re building, investing in, or operating a vertical SaaS business, this episode helps separate signal from story.See Privacy Policy at https://art19.com/privacy and California Privacy Notice at https://art19.com/privacy#do-not-sell-my-info. | — | ||||||
| 12/30/25 | AI Eats the World by Benedict Evans | In this episode of The Metrics Brothers, Ray Rike and Dave Kellogg unpack Benedict Evans’ latest landmark presentation, AI Eats the World, and explore why this moment may rival or even surpass the original “software is eating the world” era. Drawing parallels to Marc Andreessen’s 2011 thesis, they examine how AI is no longer just another platform shift, but a force capable of reshaping labor, capital allocation, and entire industries at once.The conversation spans the explosive rise in AI infrastructure spending, from hyperscaler capex surging past $400B to the growing strain on power, compute, and supply chains. Ray and Dave discuss why this moment feels different from past tech cycles, not just because of scale, but because AI directly targets labor, which represents more than half of global GDP. They explore whether AI is creating real moats or accelerating commoditization, and why many enterprises are still stuck in experimentation rather than true deployment.The episode also dives into historical parallels from elevators and telephone operators to cloud computing highlighting how software enabled automation always feels threatening before it quietly becomes invisible. Along the way, they unpack the strategic tension facing AI leaders: go down the stack for scale or up the stack for value capture. With insights on hyperscalers, OpenAI, Oracle, and the economics of AI adoption, this episode challenges leaders to rethink how value will actually be created and captured in the age of AI.If you want to understand what’s hype, what’s durable, and why “AI eating the world” may be the most consequential shift since the internet itself, this episode is a must-listen.See Privacy Policy at https://art19.com/privacy and California Privacy Notice at https://art19.com/privacy#do-not-sell-my-info. | — | ||||||
| 12/17/25 | High Alpha SaaS Benchmarks 2025 Report | In this episode of The Metrics Brothers, hosts Ray “Growth” Rike and Dave “CAC” Kellogg provide a critical deep dive into the 2025 SaaS Benchmark Report published by High Alpha. Known for their analytical, and sometimes "crusty" approach, the metrics brothers dissect the data behind 800+ SaaS companies to separate real market trends from report commentary.Key Highlights & BenchmarksThe brothers break down the report’s most significant findings with their signature skepticism regarding "correlation vs. causation."The AI Growth Premium: Companies with AI at their core are growing significantly faster than those using AI as a supporting feature. For instance, in the $1–5M ARR band, AI-core companies achieved a median growth of 110%, compared to 40% for their peersThe "Lean Team" Era: Efficiency is surging as headcount falls. Median revenue per employee has jumped to $129K–$173K, with top-tier public companies hitting over $283K. The hosts note that engineering and support have seen the largest headcount reductions due to AI automationVenture Rebound (with a Caveat): While quarterly VC deal value has returned to near 2021 levels (~$80B), the capital is highly concentrated. Over half of all VC funding is currently flowing into AI startups, often in massive "mega-rounds."In-Office vs. Remote: For the second consecutive year, the data suggests that in-office or hybrid teams are growing faster (42% median) than fully remote teams (31% median).As always, Ray and Dave offer practical advice for founders and GTM leaders:"Read the data, but watch out for the commentary." While the data is good, some commentary and conclusions in the report imply causation where there is at best some level of correlation, such as why companies stay private longer or how AI "drives" growth.Retention is King: The strongest growth outcomes are found where high Net Revenue Retention (NRR) meets short CAC payback periods.Outcome-Based Pricing: The brothers highlight the shift toward outcome-based and hybrid pricing models as a primary driver for best-in-class NRR in 2025.See Privacy Policy at https://art19.com/privacy and California Privacy Notice at https://art19.com/privacy#do-not-sell-my-info. | — | ||||||
| 12/12/25 | Expansion ARR and NRR in a Variable Pricing Environment - Part 2 | In this episode of The Metrics Brothers, Ray “Growth” Rike and Dave “CAC” Kellogg take on one of the biggest challenges facing modern SaaS and AI-Native companies: how to measure NRR and expansion when pricing isn’t fixed anymore.With the rise of usage-based, user-based-but-variable, and outcome-based pricing, the traditional world of ARR - long the backbone of SaaS metrics has been turned on its head. Contracts no longer tell the story. Spend does.Dave breaks down how to rethink ARR proxies using quarterly or monthly revenue (“implied ARR”) and why longer intervals help smooth volatility, especially for “humpback” or highly seasonal customers whose spend fluctuates dramatically month-to-month.Ray digs into what NRR was originally designed to measure and why many teams misinterpret it—especially in variable-pricing environments where a backward-looking metric can’t serve as a forward-looking forecast. The brothers explain why sequential expansion, usage behavior, and real spend patterns now matter far more than traditional ARR bridges.Key topics include:Why ARR no longer maps cleanly to revenue in a variable pricing worldHow to calculate implied ARR using quarterly or monthly software revenueWhy NRR must be interpreted differently—and why survivor bias still mattersHow volatility and seasonality distort short-interval metricsWhy usage is the real leading indicator, not invoicesHow to rethink “expansion ARR” when base + variable spend changes continuouslyPacked with examples, including sinusoidal customers, misleading GRR math, and the dangers of splitting base versus variable revenue, this episode gives operators and investors a practical framework for measuring customer growth when pricing is anything but predictable.A must-listen for CFOs, RevOps leaders, and anyone trying to modernize SaaS metrics for the AI era.See Privacy Policy at https://art19.com/privacy and California Privacy Notice at https://art19.com/privacy#do-not-sell-my-info. | — | ||||||
| 12/5/25 | Calculating NRR in Usage- and Outcome-based Pricing | In this episode, "The Metrics Brothers," Growth (Ray Rike) and CAC (Dave Kellogg), dive into a critical challenge for modern SaaS and AI-Native companies: accurately calculating Net Revenue Retention (NRR) in environments that utilize variable pricing models (usage-based, outcome-based, etc.).They begin by defining NRR, emphasizing its importance as a key metric and its high correlation with Enterprise Value-to-Revenue multiples.The brothers then dissect the primary challenge: the absence of traditional Annual Recurring Revenue (ARR) in non-annual contract models. They explore different proxies for ARR, including MRR x 12 and Implied ARR (Quarterly Revenue x 4), and discuss the pitfalls of each, particularly the risk of overstating annual revenue due to seasonality or significant one-time deals.Finally, they offer their preferred, cohort-based method for calculating NRR—the "Snowflake Method" or "Two-Year Look Back"—which compares the current revenue of a specific group of customers (cohort) to their revenue from a year ago. They conclude with a discussion on how this method helps dampen the "noise" and variability inherent in usage-based data when trying to measure expansion and contraction.📊 Key Takeaways & Discussion PointsNRR Definition & Importance: NRR measures how much recurring revenue you retain and expand from your existing customer base over a period, factoring in upsells, cross-sells, downgrades, and churn. It's a top-tier metric for investors, correlating highly with enterprise valuation.The ARR Proxy Problem: In usage-based and outcome-based models, true ARR (based on annual contracts) doesn't exist, requiring the use of proxiesMRR x 12 and Implied ARR (Q4 Revenue x 4) are common but suffer from issues like seasonality or the timing of large deals, often leading to an overstatement of forward-looking revenue.Trailing Spend is presented as the most reliable underlying truth, as it reflects the actual usage and revenue generated by the customer.Best Practice: The Cohort Method for NRR:The recommended approach is a cohort-based calculation that eliminates the need to rely on potentially flawed ARR proxies.The Calculation: Take a specific cohort of customers who existed one year ago (e.g., all customers as of December 31, 2024). Divide their revenue today (December 31, 2025) by their revenue one year ago.The Two-Year Look Back Method (Snowflake): This method is "self-correcting" as it naturally excludes new customer revenue, ensuring the NRR accurately reflects only the existing customer base.Dealing with Usage-Based Variability (Noise): Variable usage can lead to "noise" in quarterly expansion/contraction metrics. Using a trailing 12-month period (year-over-year) for the NRR calculation is safer than a quarterly view, as it dampens this volatility and provides a clearer signal of long-term customer value.If you are responsible or measured on NRR in a variable pricing model environment, this episode is a great listen to understand the pitfalls and best practices of calculating Net Revenue Retenion.See Privacy Policy at https://art19.com/privacy and California Privacy Notice at https://art19.com/privacy#do-not-sell-my-info. | — | ||||||
| 11/26/25 | The 2025 State of B2B GTM Report | For their 100th episode, Ray "Growth" Rike and Dave "CAC" Kellogg get philosophical, inspired by the notion that many hold, which is "nothing works" in B2B GTM anymore - especially in regards to pipeline development.They dive into the 2025 State of B2B GTM Report by Kyle Poyar and Maja Voijc to challenge this idea and find out what GTM leaders are actually prioritizing.In this episode, The Metrics Brothers break down:The State of the Market: Analyzing a survey of 195 GTM leaders, including data on small companies, growth rates, and the surprising lack of correlation between GTM motion and growth.The "Pipeline Crisis": Discussing why scaling existing GTM motions is the number one priority, even when many GTM leaders feel their current efforts aren't effective.Too Much Noise: A look at the "distraction chart" [slide 12] showing the staggering number of channels and strategies B2B companies are trying, and why the report suggests this is "too much".The Tried and True GTM Quadrant: Highlighting the activities with the biggest likelihood of impact, including Intimate Events, Intent-Based Inbound, and LinkedIn [slide 13].The Winner Take All Future: Exploring the massive trend of investing in Answer Engine Optimization (AEO) [slide 18] and breaking down tactical recommendations for optimizing for ChatGPT and other answer engines, emphasizing the importance of facts and platforms like Reddit and G2 [slide 19].Must Try GTM Tools: Reviewing the next generation of GTM tools, with a focus on cutting-edge platforms like Clay, Lovable, Sora, and Replit for data automation, outbound, and video generation [slide 29].Whether you're a Founder, CMO, CRO or GTM leader, this episode offers a data-driven look at where to focus your budget and attention in the year ahead.See Privacy Policy at https://art19.com/privacy and California Privacy Notice at https://art19.com/privacy#do-not-sell-my-info. | — | ||||||
| 11/20/25 | A New Agentic AI Metric: Containment Rate | In this episode of The Metrics Brothers, Ray “Growth” Rike and Dave “CAC” Kellogg break down one of the emerging metrics in the Agentic AI era: Containment Rate - the percentage of tasks an AI agent completes (resolves) end-to-end without human intervention.They explore multiple aspects of the Containment Rate Metric including:How containment rate differs from classic chatbot metric - deflection rateWhy defining “resolved” and/or "completed" is essential to calculating containment rateHow the metric connects directly to ROIWhy ROI needs to include both the benefit (cost-savings) and the investment (expense) for the AI AgentRay and Dave also trace the history of containment from IVR to Chatbots to LLM-powered agents, debate common misconceptions, and outline benchmarks across customer support, IT, HR, and back-office agentic AI workflows.If you’re building, buying, or benchmarking AI agents - or trying to turn AI investments into measurable ROI — this episode delivers the context, clarity, and humor only The Metrics Brothers can provide.See Privacy Policy at https://art19.com/privacy and California Privacy Notice at https://art19.com/privacy#do-not-sell-my-info. | — | ||||||
Showing 25 of 123
Pitch Fit is a Pro feature
See how bookable this show is for guests, which brands already advertise, the per-episode ad value, and the best-fit guest and sponsor profile. The numbers are blurred on the free plan.
How readily this show books outside guests like you.
How proven this show is for host-read sponsorships.
For Guests
ProFor Advertisers
ProUpgrade to Pro to unlock guest cadence, sponsor categories, fit scores, and per-episode ad value for this show.
Chart Positions
11 placements across 11 markets.
Chart Positions
11 placements across 11 markets.