Podcast Market Insights: How to Benchmark a Show's Audience Against Its Category Before You Pitch, Buy, or Invest
Every podcast advertiser, agency, and rising creator eventually hits the same wall: the raw numbers on a podcast's page do not tell you whether the show is actually a good bet. A podcast that says it has 250,000+ monthly listeners sounds enormous in isolation. But what if the average comedy podcast in the same language and region also has 250,000+ monthly listeners? Suddenly that show is not a giant. It is the median. It is the floor of the category, not the ceiling.
This is exactly the gap that CastFox built Market Insights to close. On every podcast page on castfox.net, we surface a side-by-side, category-by-category comparison of the show's estimated listener range and the category's podcast count, with arrows and competition badges that let you read a show's competitive position in roughly two seconds. No spreadsheets. No third-party tools. No guessing.
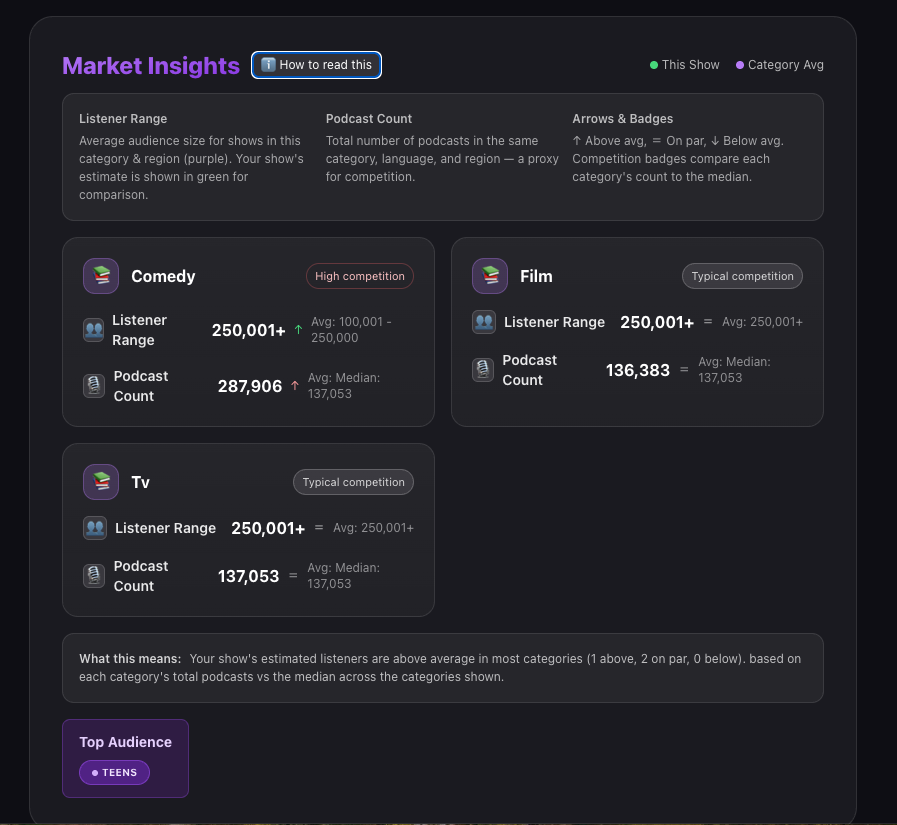
CastFox Market Insights on a real podcast page: per-category Listener Range, Podcast Count, arrows vs. category average, and competition badges — all readable in roughly two seconds.
This guide is the long version of that two-second read. We will walk through what podcast Market Insights actually measures, how the listener-range and podcast-count benchmarks are computed, how to interpret the "High competition" vs. "Typical competition" badges, and most importantly: how to use this data to make smarter decisions whether you are buying ads, pitching as a guest, deciding whether to launch a new show, or building an outreach list with PodcastGPT.
In This Guide
- Why Market Insights Matters More Than Raw Listener Counts
- What CastFox Market Insights Actually Shows You
- The Listener Range Metric: How We Estimate Audience Size
- The Podcast Count Metric: A Proxy for Category Competition
- Arrows and Competition Badges: The 2-Second Read
- Worked Example: Reading "The Toast" by Dear Media
- How Advertisers Should Use Market Insights
- How Podcast Guests and PR Teams Should Use It
- How Podcasters and Networks Should Use It
- Five Common Mistakes When Reading Podcast Audience Benchmarks
- A Repeatable Workflow: From Market Insights to Pitch Sent
- Frequently Asked Questions
Why Market Insights Matters More Than Raw Listener Counts
The single most expensive mistake in podcast advertising and podcast PR is treating raw audience size as if it were the same thing as category strength. They are not even close.
Imagine two shows. Show A has 80,000 monthly listeners in the True Crime category in the United States. Show B has 80,000 monthly listeners in the Christian Spirituality category in the United States. On paper, identical reach. In reality, Show A is a small fish in a giant ocean — True Crime has tens of thousands of competing podcasts and an average listener base in the high six figures. Show B, on the other hand, is potentially a top-quartile podcast in its niche. Same audience number, completely opposite competitive position. An advertiser who treats them as interchangeable will systematically overpay for the wrong one.
This is why CastFox does not just show you the show's numbers in isolation. We show you the show's numbers against the category average for that exact category, language, and region combination. A 250,001+ listener range only means something once you know whether the average comedy podcast in English in the US is at 100,001-250,000 (above-average performance) or 250,001+ (median performance).
What CastFox Market Insights Actually Shows You
On every podcast detail page on castfox.net, scroll past the show's basic info, hosts, episodes, and contact details, and you will find the Market Insights module. It looks like this:
- One card per category the show is classified in. Most podcasts sit in 2-4 categories on Apple Podcasts and Spotify, so you usually see 2-4 cards.
- Inside each card, two metrics: Listener Range (an estimated audience bucket for the show) and Podcast Count (how many shows are competing in that category, language, and region).
- Next to each metric, a small arrow (↑ above average, = on par, ↓ below average) and a number showing the category average for the same metric.
- In the corner of each card, a competition badge: "Low competition", "Typical competition", or "High competition", computed by comparing the category's total podcast count to the median count across all categories shown.
- Below the cards, a one-sentence plain-English summary: "Your show's estimated listeners are above average in most categories (1 above, 2 on par, 0 below). Based on each category's total podcasts vs the median across the categories shown."
- And, when available, a Top Audience chip — a quick demographic skew (e.g. Teens, Millennials, Boomers) for the show's likely core listener.
Everything is rendered in dark mode, mobile-friendly, and free for anyone to read. You do not need a CastFox account, a paid plan, or even an email. We believe that if you are spending real money on podcast advertising or real time on podcast outreach, you should at minimum have the right context to do it.
The Listener Range Metric: How We Estimate Audience Size
Podcasts almost never publish their real download or listener numbers. Apple Podcasts hides them. Spotify hides them. Most RSS feeds hide them. Even private podcast hosts that do have the truth (Megaphone, Art19, Acast, Libsyn, Simplecast, Buzzsprout) only show the numbers to the show's owner. So how does anyone — CastFox, Rephonic, Podchaser, Chartable historically — produce an audience number at all?
The honest answer: every public number you see on a podcast intelligence platform is an estimate derived from public signals. The serious platforms differ in which signals they use and how confidently they bucket the result. CastFox publishes an estimated listener range rather than a single magic number, because ranges communicate uncertainty honestly.
The signals we combine
- Apple Podcasts chart history — current and historical chart positions in the show's category, sub-category, and country. A show that has held a top-50 comedy chart slot for two years has a vastly different floor than one that briefly cracked top 200.
- Apple Podcasts ratings velocity — not just the lifetime rating count but how fast new ratings are accumulating. Reviews-per-month is one of the strongest publicly observable proxies for active listenership.
- Spotify popularity tier — Spotify exposes a coarse popularity score that maps reasonably well to audience size for shows that distribute on Spotify (which is most shows in 2026).
- Episode publishing cadence and longevity — a show running weekly for five years with consistent ratings velocity has a much larger and more loyal audience than a show with the same lifetime numbers compressed into six months.
- Network and host signals — whether the show is on a known network (Wondery, iHeart, Dear Media, Earwolf, NPR, Pushkin, etc.), and the public reach of the host(s).
- Web and social signals — backlinks, Wikipedia, organic search interest, YouTube subscriber and view counts when the show is also distributed as video, and cross-platform mentions.
Why we publish a range, not a number
Because no public model can tell you the difference between 187,432 and 213,019 monthly listeners with any honesty. What we can tell you with high confidence is that a show is comfortably in the 100,001-250,000 bucket and not in the 10,001-50,000 bucket. Bucketing is the right unit for the data we have.
The buckets you will see on CastFox: 0-1,000, 1,001-10,000, 10,001-50,000, 50,001-100,000, 100,001-250,000, and 250,001+. A show in the top bucket is, by our model, in the top ~3% of all active English-language podcasts globally.
What the category average means
The "Avg:" number next to each Listener Range is not the mean across all 3+ million podcasts in the world. That would be uselessly small. It is the average estimated listener bucket for active podcasts in the same category, language, and region as the show you are looking at. So when a show in the Comedy category in English in the US shows "Avg: 100,001-250,000", that is the average across active English-language US comedy podcasts that have published in the recent window we use to define "active." A podcast that hasn't released an episode in two years is excluded from the denominator.
The Podcast Count Metric: A Proxy for Category Competition
Listener Range tells you how big the show is. Podcast Count tells you how crowded the show's category is. Together they tell you how hard it will be to reach the show's audience through advertising, to break through with a guest pitch, or to launch a competing show.
The Podcast Count number on each Market Insights card is the total number of active podcasts in that exact category, language, and region triple. Active means published an episode in the recent window. Same definition as for Listener Range.
Next to it, you will see "Avg: Median: 137,053" (or whatever the relevant number is). The "Median" here is the median podcast count across all categories shown for this specific show. We use median rather than mean because category sizes are extremely long-tailed — a small handful of mega-categories (Comedy, News, Business, Health & Wellness) can pull a mean wildly upward and make every other category look small. Median is the more honest comparison.
Why podcast count is a competition proxy
Two reasons.
- Listener attention is fixed; supply is not. The number of hours of podcast listening per person per week grows slowly. The number of podcasts launched per week grows quickly. A category with 287,906 active podcasts is fighting for the same listener hours as a category with 18,000 active podcasts. Per-show CPMs, sponsorship rates, and pitch reply rates all reflect that.
- It is the variable that scales with effort, not luck. A small comedy podcast can become a big comedy podcast through years of consistent work, but it cannot un-crowd its category. If you are choosing where to compete — as a brand, as a creator, as a guest — the structural crowdedness of the category is the thing that does not change after you commit.
Arrows and Competition Badges: The 2-Second Read
The Market Insights module is designed to be read in two seconds at a glance and in two minutes if you want the nuance. Here is the legend for the visual cues.
Arrows next to each metric
- ↑ Above average — the show's value is higher than the category average for that exact category-language-region combination.
- = On par — the show's value is in the same bucket as the category average. For Listener Range, this means same bucket. For Podcast Count, "on par" doesn't really apply because podcast count is a property of the category, not the show, so the arrow next to Podcast Count compares the category's total to the median across the show's categories.
- ↓ Below average — the show's value is lower than the category average.
Competition badges in the corner of each card
- Low competition — this category's total podcast count is meaningfully below the median across the show's categories. If you are targeting the show's audience through this category, you have a structurally easier path.
- Typical competition — this category's podcast count is roughly at the median. Standard difficulty.
- High competition — this category's total podcast count is meaningfully above the median. Expect higher CPMs, lower pitch reply rates, and more shows fighting for the same listener attention.
The plain-English summary line
Below the cards you'll see one sentence summarizing how the show stacks up on Listener Range across its categories: e.g. "Your show's estimated listeners are above average in most categories (1 above, 2 on par, 0 below)." The parenthesis counts the arrows so you don't have to. If you only read one thing, read that sentence — it's the TL;DR of the entire module.
Worked Example: Reading "The Toast" by Dear Media
Let's walk through a real example using The Toast, the daily talk show by Jackie and Claudia Oshry on the Dear Media network. On its CastFox page, the Market Insights module currently shows three category cards: Comedy, Film, and TV, with the following data.
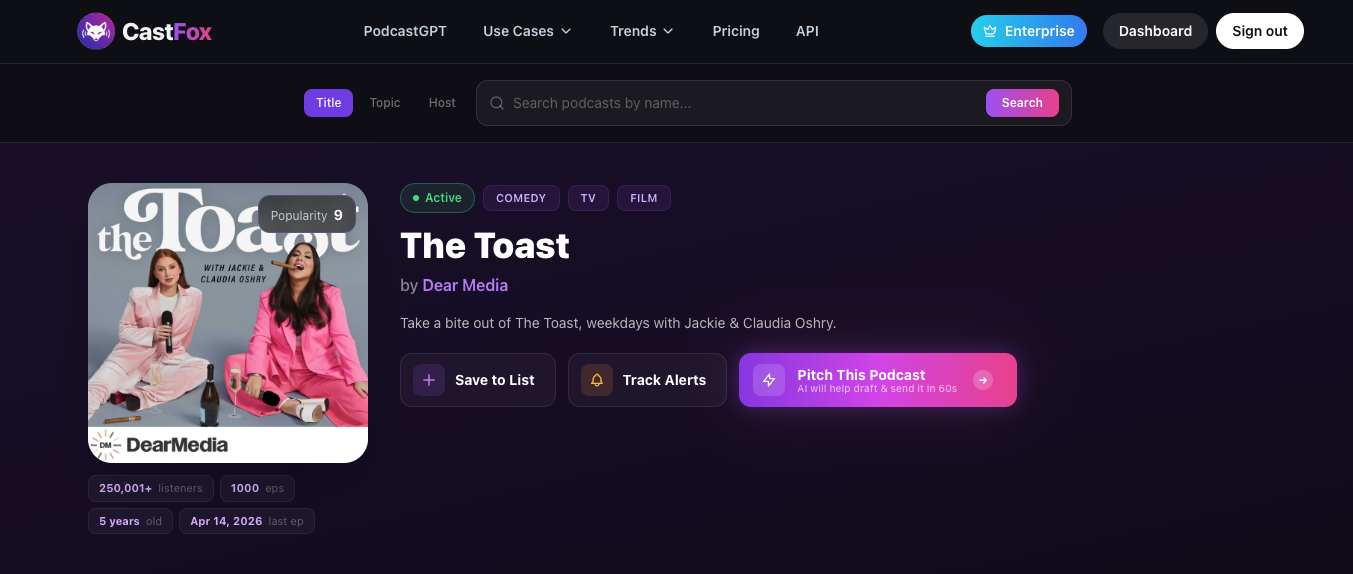
The Toast by Dear Media on CastFox — 250,001+ listeners, classified in Comedy, TV, and Film. Below this header sits the Market Insights module we read in the worked example.
| Category | Listener Range | vs. Avg | Podcast Count | vs. Median | Competition |
|---|---|---|---|---|---|
| Comedy | 250,001+ | ↑ Above (Avg: 100,001-250,000) | 287,906 | ↑ Above (Median: 137,053) | High competition |
| Film | 250,001+ | = On par (Avg: 250,001+) | 136,383 | = On par (Median: 137,053) | Typical competition |
| TV | 250,001+ | = On par (Avg: 250,001+) | 137,053 | = On par (Median: 137,053) | Typical competition |
And the summary line: "Your show's estimated listeners are above average in most categories (1 above, 2 on par, 0 below)." Top Audience chip: Teens.
What this actually tells us
Even without knowing The Toast's exact download numbers, Market Insights tells you a complete competitive story in one screen.
- It is a top-bucket show by reach. 250,001+ monthly listeners is the highest bucket we publish. So the show is in the top ~3% of English-language US podcasts globally.
- Its real edge is in Comedy, not Film/TV. In Film and TV, an average podcast is also in the 250,001+ bucket — because the population of active film and TV podcasts in English in the US is small enough that the ones that exist tend to be larger productions. So being top-bucket there is "on par." In Comedy, the average is 100,001-250,000, which means The Toast is genuinely outperforming the typical comedy podcast.
- The Comedy category is a knife fight. 287,906 active podcasts vs. a 137,053 median across the show's categories. That's the highest-supply category the show is in by a wide margin, and the badge correctly flags it as High competition.
- Film and TV are open lanes. Both are at or just below the median podcast count. If you are an advertiser whose buyer is The Toast's exact audience, the structurally cheaper path to that audience may run through other Film/TV shows with smaller followings rather than other top Comedy shows where every brand is bidding.
- The Top Audience chip says Teens. Combined with the Dear Media network context and the show's content, that's a strong signal for Gen Z lifestyle, beauty, food, and entertainment brands — and a weak signal for B2B SaaS, retirement products, or anything with a 45+ buyer.
How Advertisers Should Use Market Insights
If you're buying podcast media — whether you're an in-house performance marketer at a DTC brand, a media buyer at an agency, or a founder doing your first host-read deal — Market Insights changes how you build your shortlist. Here is the playbook we recommend, built on top of CastFox's broader stack including PodcastGPT, Lists, and Alerts.
Step 1: Define your buyer in podcast-relevant terms
Before you look at any show, write down the demographic and category profile of your ideal listener. Not "women 25-45 who like wellness" — that's too vague. Closer to: "Women 28-40, household income $90K+, college-educated, urban, already buying premium skincare or supplements, primary podcast time is morning commute, top categories: Health & Wellness, Comedy, True Crime, Entrepreneurship." The categories at the end matter, because the next step is grading shows against those categories specifically.
Step 2: Build a longlist of 50-150 shows, then read every Market Insights card
Use CastFox search, PodcastGPT prompts ("find me 100 active English-language podcasts in Health & Wellness with US listeners and a host who reads ads"), or import a list you already have. Then for each show on the longlist, open the CastFox podcast page and read the Market Insights module. You're looking for two things: the show's listener range and the competition badges across its categories.
Step 3: Sort the longlist by category fit, not absolute reach
Here is the counter-intuitive move that separates good media buyers from average ones. Do not sort your longlist by listener range descending. Sort it by category fit and overperformance. A show that is above average in your target category is almost always a better media buy than a show with twice the absolute audience that is on par in a tangential category. Why? Because the above-average show is differentially attractive to listeners who care about that category. Their audience is denser in your buyer.
Step 4: Use the competition badge to set price expectations
Going into outreach, you should already have a CPM range in your head. Shows in High competition categories will quote you 30-100% higher CPMs than equivalent-reach shows in Typical or Low competition categories, because demand is higher. If you find an above-average performer in a low-competition category, that is the unicorn you build campaigns around: high-fit audience at a structural discount.
Step 5: Pitch and track in CastFox
Once your shortlist is set, use CastFox Lists to organize it, My Pitches to send and track outreach, and Alerts to get notified when any show on your list publishes a new episode worth pitching against.
How Podcast Guests and PR Teams Should Use Market Insights
The guest economy on podcasts is bigger and more competitive than ever. Top-bucket shows in popular categories receive hundreds of cold pitches a week. Market Insights helps you do something most guest-pitchers never do: pick targets where the structural odds favor you.
Avoid the "biggest podcast in the biggest category" trap
A first-time author or founder will instinctively pitch the largest podcast they can find. That is almost always a strategic mistake. The largest podcast in the largest category gets the most pitches, has the most gatekeepers, books guests months out, and is structurally the hardest first win. Market Insights flags exactly this with the High competition badge. Use it as a "do this third, not first" indicator.
Look for over-performers in low-competition adjacent categories
Many shows are cross-listed in 2-4 categories. The biggest, most competitive category usually drives the show's discovery, but the smaller adjacent category is where you have a clean angle for a pitch. Example: a finance founder pitching a Business podcast that is also listed in Self-Improvement or Society & Culture has a much easier time leading with a self-improvement angle than competing with the 800 finance pitches per week the host already gets.
Mention the data in your pitch
Hosts notice when a pitch shows real preparation. A line like "I've been listening since you broke into the top 5% of Comedy by Listener Range last year — wanted to bring you something on a Film/TV-adjacent angle that fits your secondary category" reads as a researched human, not a templated outreach email. Market Insights gives you the language for that line in two seconds.
How Podcasters and Networks Should Use It
If you're the creator of the show, Market Insights is also a self-diagnostic. Open your own podcast page on CastFox and read it as if you didn't make the show.
Are you in the right categories?
Apple Podcasts and Spotify both let you pick a primary and secondary category. Many shows pick categories on launch day and never revisit. If your Market Insights shows that you are below average in a high-competition primary category and well above average in a low-competition secondary one, you have a real signal: consider switching the primary. You will discover better, get pitched better guests, and attract better-fit advertisers.
Are you positioned for the right advertisers?
The Top Audience chip is a hint about which buyer profile your show appeals to. A creator who sees Teens on their card and is currently chasing financial advisor sponsorships should reconsider the match. The reverse is true too — a show with a Boomers chip pitching Gen Z fashion brands is fighting the data.
Track your benchmark over time
We refresh Market Insights regularly. If your Listener Range bucket moves from 50,001-100,000 up to 100,001-250,000, that is a real, externally observable jump in your show's standing. It belongs in your media kit.
Five Common Mistakes When Reading Podcast Audience Benchmarks
1. Comparing across regions or languages
A 100,001-250,000 listener range in English-US Comedy means something completely different from the same range in Spanish-Mexico Comedy, because the underlying pool of listeners and competitors is different. CastFox always benchmarks within the show's specific category-language-region triple. If you're reading a different platform that gives you a global average, treat it skeptically.
2. Treating the listener range as a precise number
A show in the 250,001+ bucket might have 260,000 monthly listeners or 2.6 million. The bucket is honest about what we can prove publicly, not a precise count. Use it for sorting and benchmarking, not for download-level financial modeling.
3. Ignoring inactive shows in the denominator
We exclude long-dormant podcasts from category counts because including them inflates competition artificially — a podcast that hasn't published in three years is not competing with anyone for listener attention today. Some other tools include them. That's why our podcast count for a category may be lower than what you'll see elsewhere; it is more honest.
4. Reading only the primary category
Most actionable insight comes from the secondary category cards, not the primary one. The primary tells you what the show says it is. The secondary cards often reveal the easier path to the same audience.
5. Forgetting that competition cuts both ways
A high-competition category is a more expensive market to buy into and a more proven market with active demand from advertisers and listeners. A low-competition category is easier to dominate and may be smaller because it's less monetizable. Read the badge in context with your goal.
A Repeatable Workflow: From Market Insights to Pitch Sent
Putting it all together, here is a concrete workflow that an advertiser or guest pitcher can run in an afternoon using only CastFox.
- Define buyer profile — write the 2-3 line target audience description and the 3-5 ideal categories.
- Generate the longlist with PodcastGPT — prompt for 100 active podcasts matching the categories, language, and region.
- Open each show's CastFox page — read the Market Insights module for each show on the longlist.
- Score every show on three axes — listener-range bucket vs. category average (over/on/under), competition badge of best-fit category (low/typical/high), Top Audience chip match to your buyer (yes/partial/no).
- Cut the longlist to a shortlist of 20-40 — keep over-performers in low or typical competition categories that match your audience chip. Drop the rest, even if they have larger absolute reach.
- Save the shortlist as a List — use CastFox Lists.
- Pitch through My Pitches — use My Pitches to draft, send, and track. Reference the Market Insights data in your subject line for differentiated outreach.
- Set Alerts — let Alerts notify you when any show in your list ships a new episode so you can pitch a relevant follow-up while it's hot.
That workflow, run honestly, will outperform a "biggest first, smallest last" media list every time we've seen it tried, in both advertising and guest PR.
Frequently Asked Questions
How accurate are CastFox listener ranges?
The bucket boundaries are correct in the high majority of cases for active podcasts where we have enough public signal. We deliberately use coarse buckets rather than precise counts because no public model can claim individual-podcast precision honestly. If you are doing financial modeling you should request an in-host download report from the show owner; for shortlist filtering and benchmarking, the buckets are designed to be the right unit.
Is Market Insights free?
Yes. Every podcast page on castfox.net shows Market Insights for free — no account, no paywall. CastFox's paid tiers add tools like PodcastGPT credits, advanced contact data, alert volume, and team features. The benchmarking data itself is open.
What categories do you support?
All major Apple Podcasts and Spotify top-level categories, plus the most active sub-categories. We benchmark within the show's specific category-language-region combinations, which means our coverage scales with the show's own classification rather than imposing a fixed taxonomy.
How often is the benchmark data updated?
Listener Range estimates and category podcast counts are refreshed on a rolling basis. Shows that recently changed categories, gained or lost a major chart position, or had a significant ratings velocity change will see their Market Insights update within a normal refresh cycle.
Can I get this data via API?
Yes. CastFox exposes podcast data including audience benchmarks through our developer API. See the API page for documentation and access.
How is "competition" decided as Low / Typical / High?
For the categories shown on a given podcast page, we compute the median podcast count across them. Categories meaningfully below the median are flagged Low competition, those near the median are Typical, those meaningfully above are High. We use median rather than mean because podcast category sizes are heavily long-tailed.
Why don't I see a Top Audience chip on every show?
The Top Audience chip is shown when we have enough confidence in the demographic skew signal for that show. For very new shows, very small shows, or shows with mixed demographics where no single segment dominates, we suppress the chip rather than guess.
What's the difference between Market Insights and full demographic data?
Market Insights is a per-show competitive benchmark: how does this show compare to others in its category? Demographic data is a per-genre population profile: who, on average, listens to this kind of show? The two are complementary. Use Market Insights to pick a shortlist; use demographics to validate audience-buyer fit.
The Bottom Line
The hardest part of podcast advertising and podcast PR has never been finding podcasts. Apple Podcasts has millions of them. The hard part is knowing which podcast is actually a good position — the right size for its category, the right competitive structure for your budget, the right audience for your buyer. CastFox's Market Insights is built for that question and only that question. It is free, it is on every podcast page, and it is designed to be readable in two seconds.
Open any podcast on castfox.net and look for the Market Insights module. If you're still benchmarking podcasts using only their absolute listener counts, you're leaving money — and meetings, and downloads, and guest spots — on the table.
Ready to use Market Insights on your next podcast list?
Start free. Open any podcast on CastFox to see its Listener Range, Podcast Count, competition badges, and Top Audience chip. No signup required.